Adding a Graph Element to an Existing Graph Object
You have two options for adding a graph element to
an existing graph object. You can overlay the new graph element on
top of an existing graph element. Or, you can add the graph element
so that it creates a cell in a new row or column.
Add an Overlay
In an overlay, one graph element is superimposed on another graph element. You can add an overlaid graph element to a single-cell graph as well as to a lattice.
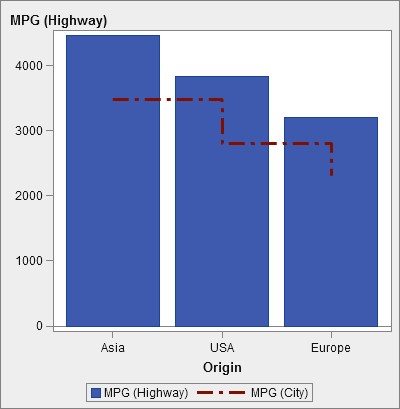
In this example, a
step plot is overlaid on a bar chart. The example shows the graph
element with data assigned to it.
Step Plot Overlaid on a Bar Chart
To create an overlay:
-
Drag and drop a graph element from the Graph Elements pane onto the canvas.
-
Drag and drop a second graph element directly onto the existing graph element.If the graph elements are compatible, they are automatically assigned a shared role. This enables both graph elements to have a common X axis role. You can unshare the shared role if needed.Some graph elements, such as the pie chart and the treemap, cannot be layered in an overlay. A message is displayed when you try to drag and drop these types of graph elements.For more information, see the following topics:
-
(Optional) On the Role Definitions tab, you can change the default role names to provide more meaningful names.
Tip
The graph elements are layered
in the order in which they were added to the canvas. You can change
the order by moving a graph element to the front or the back. For more information,
see Change the Order of Graph Elements in a Cell.Add a Graph Element to a New Row or Column
A graph element can be added so that it creates a cell in a new row or column. This
arrangement results
in a graph object with more than one cell. It is called a user-defined lattice. In a user-defined lattice, each cell is created independently and can contain different types of graph
elements.
Cells are aligned in rows and columns that you create by dragging and dropping graph
elements.
Note: You cannot create new rows
or columns in a data-driven lattice. For a description
of a data-driven lattice, see About Data-Driven Lattices .
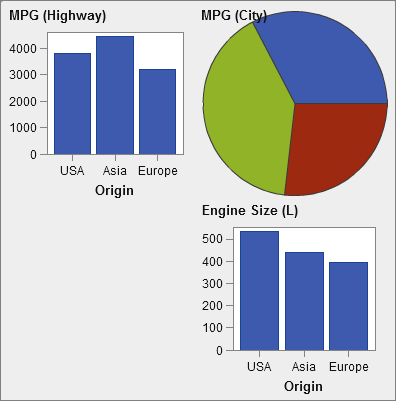
This example shows
a user-defined lattice with four cells. One of the cells is empty.
The example shows the graph element with data assigned to it.
User-Defined Lattice
To create a user-defined
lattice:
-
Drag and drop a graph element from the Graph Elements pane onto the canvas. The graph element is created in the center of the graph area of the canvas.
-
Drag and drop another graph element onto the canvas as follows:
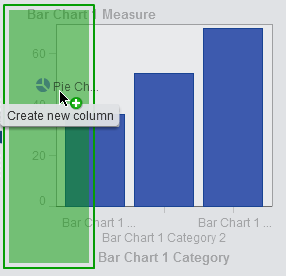
-
Drag and drop the graph element onto the right or left border of the existing graph to create a new column. The area becomes shaded to indicate the location of the new column.
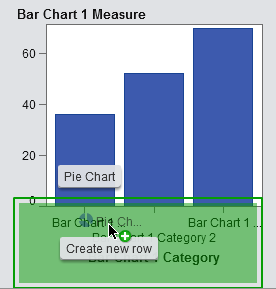
-
Drag and drop the graph element onto the top or bottom border of the existing graph to create a new row.
-
-
To add more cells, continue dragging and dropping graph elements onto the borders of the existing graph to create new columns or rows. You can drag and drop a graph element onto the area between two columns to insert a new column. Or, you can drag and drop a graph element onto the area between two rows to insert a new row. If the existing graph contains a lattice with an empty cell, you can drag and drop the graph element into that empty cell.You can create up to 10 rows and 10 columns.
-
(Optional) On the Role Definitions tab, you can change the default role names to provide more meaningful names.
Copyright © SAS Institute Inc. All Rights Reserved.
Last updated: January 8, 2019