Working with Data Items in a Report
About Data Items
You decide which data items to use to define a query for each report object. You can
use all the data items in the data source or a subset of data items. Each data item is classified as either a category or a measure.
The designer can display data items using an existing user-defined format that has already been specified externally for a data column in a data source. However, you cannot specify a new or different user-defined format
for a data item in the designer.
You can create a custom
sort so that data items in a table or graph can sort to the top or
to the bottom. Category data items, calculated items that are categories,
and custom categories also support custom sorts. For more information,
see Using a Custom Sort.
For information
about filtering data items, see Use a Data Source Filter in a Report.
|
Data Item
|
Icon
|
Description
|
|---|---|---|
|
Aggregated Measure or Time Period Calculation
|
 |
A data item that represents special predefined operations, like distinct count, percentage of totals, percentage of subtotals, or frequency percent. Or, users can
define their own aggregated measure calculations.
Aggregate measures can be used in only some report objects. They cannot be used in
filters, controls, spark lines, or time series graphs. Percentage of subtotal items (including row total, row subtotal, column total,
and column subtotal) can be used only in crosstabs. Some aggregated measure calculations
cannot be used in a detail rank.
|
|
Calculated
|
 , ,  , or , or  |
A data item that is calculated from existing data items by using an expression. For
example,
you could create a calculated data item called Profit,
which is created by using this expression:
[Revenue]
                                    — [Cost]
, where Revenue and Cost are measures in a data source.
Calculated dates and times are treated as categories with distinct values being governed by the date or time format that you have chosen. Numeric calculated items can be treated as measures (with an
aggregation type such as Sum, which is applied to each distinct category combination).
Or, you can change numeric calculated items into category data items with distinct
values being governed by the number of decimal places in the numeric format.
|
|
Category
|
 |
A data item whose distinct values are used to group and aggregate measures. There are five types of categories: alphanumeric, date, datetime, time, and numeric. Alphanumeric categories can be made up of all
letters, all digits, or a combination of the two. Categories that have values that
are all digits might be physically stored as character or numeric data. The data type affects how values are handled in relation to some functionality, such as filtering,
sorting, and formatting.
Examples of alphanumeric categories include data items such as Product ID, Country, Employee
Number, and Employee Name.
Alphanumeric categories sort lexically.
Date, datetime, time,
and numeric categories are sorted by their underlying numeric values.
Category data items can also be numeric. A category data item sorts differently than an alphanumeric data item. Numeric category data items sort
by number.
Note: If you change a measure to
a category, then it uses this category icon.
The
 icon indicates a user-defined format category data item. User-defined format categories
can be based on underlying numeric or character data. icon indicates a user-defined format category data item. User-defined format categories
can be based on underlying numeric or character data.
|
|
Date
and Time
|
 |
A category data item whose distinct values are used to group and aggregate measures.
There are three types of date categories: date, datetime, and time.
Examples of date, datetime,
and time categories are Order Year, Date
and Time of Sale, and Customer
Wait Time.
|
|
Frequency
|
 |
A measure data item whose value represents the number of times an observation occurs in the selected data source. SAS Visual Analytics automatically adds this
data item to the Data tab under the Measure heading
when you select a data source. You cannot change the classification
for the frequency data item.
|
|
Frequency
Percent
|
|
A measure data item whose value is based on the percentage of occurrence in the selected
data source. SAS Visual Analytics automatically adds this data item to the Data tab under the Aggregated Measure heading when you select a data source. You cannot
change the classification for the frequency percent data item.
|
|
Geography
|
 |
A category data item whose values are mapped to geographical locations or regions.
Geography data items
can be used in reports to show your data on a geographic map. For example, a geography
data item can identify geographic information that is specific to your organization
(for example,
sales regions, warehouse locations, oil platforms, and so on). For more information,
see Working with Geography Data Items.
The geography icon can
also indicate that all data items in a hierarchy are based on geography.
|
|
Hierarchy
|
 |
A data item whose values are arranged with more general information at the top and
more specific
information at the bottom. The first level in the hierarchy is the root level. For example, you might have a Date hierarchy,
which includes the Year (the root level), the Quarter, and
then the Month. You can also
have geographic hierarchies.
|
|
Measure
|
|
A data item whose values can be used in computations. These values are numeric. Examples
of measures
include Sales Revenue, Units
Sold, and Salary.
The designer assigns a default aggregation method to every measure. Almost all measures are assigned Sum. You can change the aggregation
method.
|
Note: Report objects that are imported
from SAS Visual Analytics Explorer (the explorer) use either live
or on-demand data. For on-demand data, you can update the properties
and styles for these report objects in the designer, but you cannot
change the data assigned to them.
Assign Data Items
To assign data items
to use in queries for the current report section:
-
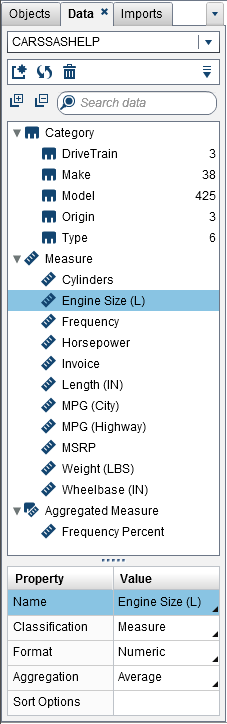
On the Data tab in the left pane, click the down arrow to display a list of available data sources. Select a data source, and the Data tab is populated with a list of all of the data items that are in the data source.If the data source that you want is not in the list, click
 , which displays the Add Data Source window.
Select the data source that you want, and then click Add.
The Data tab is populated with a list of
all of the data items that are in the data source.
If you do not want to use the data source that you originally selected, click
, which displays the Add Data Source window.
Select the data source that you want, and then click Add.
The Data tab is populated with a list of
all of the data items that are in the data source.
If you do not want to use the data source that you originally selected, click . Click Delete in the confirmation message that is displayed.
-
Select an existing report object that uses the same data source name or add a new report object to the section.
-
Drag and drop a data item onto the canvas. The data item is automatically assigned a data role. For more information, see Automatic Data Item Assignments.TipYou can use the Ctrl key to select multiple data items, and then drag and drop them onto the canvas.Alternatively, you can right-click on a data item, and select Add Data Item to <ReportObject>, where
<ReportObject>is the name of the report object in the report. (For example,List Table 1,Bar Chart 1, and so on.)Note: You cannot double-click the icon for a data item and assign it to the report. -
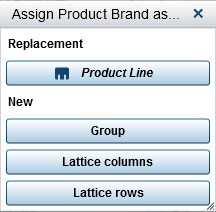
If the selected data item can replace a current data item in the report object or if the selected data item is valid for multiple data roles, then select the data assignment from the Assign <DataItemName> as window. A data assignment that is marked with a red asterisk (*) is required before the query can be run.
 For more information about aggregations, see Aggregations for Measures.
 -
(Optional) To see more information about a data item, select it in the list. The Name, Classification, Format, and Aggregation are displayed in the data item table below the list of data items. For a category data item with a user-defined format that has an underlying numeric value, you can specify Sort Options.
Automatic Data Item Assignments
When you drag and drop data items on a report object, the designer automatically assigns them a data role.
For a single data item, the data item is assigned to an empty and required data role
before you are prompted
to replace an already assigned data item. For multiple data items, the data items
are assigned to all empty and required data roles that accept the data items. There
is a special case for a measure data role that allows multiple data items. In this
special case, the designer automatically assigns all of the data items to the Measures data
role.
Note: Hierarchy data items cannot
be used in the automatic assignment of multiple data items. Also,
the animation role and data tip role are not automatically assigned.
For more information
about data roles, see Working with Data Role Assignments.
Duplicate Data Items
Duplicating measure data items in the designer enables you to see the aggregations
of a data item side by side in a table. For a list of the available
aggregation types, see Aggregations for Measures. You can duplicate a numeric measure if you want to use it as a category to group other values in some tables or graphs.
If you save a report with duplicate data items, then those data items are available
when you edit the report the next time.
You can duplicate a calculated data item to make a variation of a calculation. For
example, you might make similar calculations
involving miles per gallon for a vehicle, but you create one calculation using
MPG
                        (City)
and another using MPG
(Highway). You can duplicate any data item if you want to use it with more than one format
in your report. For example, you might change Month to Year for
a date data item.
To duplicate a data
item:
-
On the Data tab in the left pane, right-click the data item that you want to duplicate. Select Duplicate Data Item.All of the properties of the original data item are copied to the duplicate data item. The duplicate data item appears in the list of data items on the Data tab. For example, if the original data item name is
Engine
                                    Size
, then the duplicate data item is displayed asEngine Size (1). If you choose to duplicate the same data item again, then it is displayed asEngine Size (2). -
(Optional) Rename the duplicate data item.
-
(Optional) Change the format or aggregation for the duplicate data item.
-
(Optional) Edit the calculation for a calculated data item or aggregated measure.
-
(Optional) Change the sort options for a category data item with a user-defined format that is based on an underlying numeric value.
-
(Optional) Change the classification for the data item. For example, a numeric data item that has been duplicated and is not yet assigned to a report object can be a category or a measure.
Rename Data Items
You can rename data items in the data source using the Data tab.
To rename data items:
-
On the Data tab, right-click on a data item, and then select Rename Data Item. The Rename Data Item window is displayed.
-
Enter a new name. The name cannot be used by another data item in the same data source.
-
Click OK.
Alternatively, you can use the data item table at the bottom of the Data tab
to rename a data item. For the Name property,
enter a new name for Value.
Search for Data Items
If your data source contains many data items, you can search for particular data items
using the Data tab.
To search for data
items:
-
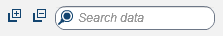
Enter the name of a data item in the search field on the Data tab. The field is located above the list of data items.
-
(Optional) Click
 to collapse the list of data item groupings or click
  to expand the list of data item groupings.
-
Click
 to clear the search term and display all of the data items in the data source.
Create a Distinct Count for a Category Data Item
A distinct count query is useful in many ways. For example, you might want to know
the number of distinct
products that were purchased during a specific time period. Or, you might want to
know which products have the most customers or which products have the most customers
in a particular geographic region. You can create a distinct count for category data
items only.
Note: If your category contains
missing values, then distinct count is increased by one.
To create a distinct
count aggregated measure data item:
-
On the Data tab in the left pane, right-click the category data item that you want to use for the distinct count.
-
Select Create Distinct Count.The distinct count data item appears in the list of data items with a name that is derived from the original name. For example, if the original data item name is
Date, then the distinct count data item is displayed asDate (Distinct Count). The icon identifies the new distinct count data item
on the Data tab.
Create Derived Items for Measures
You can create derived data items that are aggregated measures in the designer. The
aggregated measure does not contain data values in itself, but when it is used in
a report object, it
displays the value for the measure and formula type on which it is based. An example
is a percentage of total.
Here are some key points
about derived items:
-
Derived data items cannot be used in filters or controls.
-
Period calculations cannot be derived from measures with certain aggregations.
To create a derived
item from a report object:
-
In the report object, right-click on the measure data item that you want to use for the derived item.
-
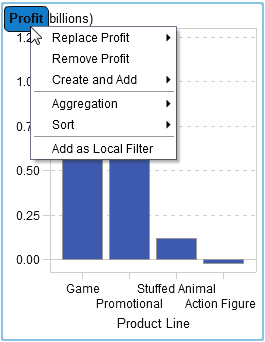
Select Create and Add, and then select one of the following:Displays the difference between the value for the current time period and the value for the previous time period. For example, you might derive the difference between sales for the current month and sales for the previous month.Note: This derived item is not available if your data source does not contain a date data item that includes the year.Difference from Previous Parallel PeriodDisplays the difference between the value for the current time period and the value for the previous parallel time period within a larger time interval. For example, you might derive the difference between sales for the current month and sales for the same month of the previous year.Note: This derived item is not available if your data source does not contain a date data item that includes the year.Displays the percentage difference between the value for the current time period and the value for the previous time period. For example, you might derive the percentage difference between sales for the current month and sales for the previous month.Note: This derived item is not available if your data source does not contain a date data item that includes the year.Displays the percentage difference between the value for the current time period and the value for the previous parallel time period within a larger time interval. For example, you might derive the percentage difference between sales for the current month and sales for the same month of the previous year.Note: This derived item is not available if your data source does not contain a date data item that includes the year.Displays the percentage of the subtotal value for the measure on which it is based. You can create a percentage of subtotal only when the source data item has an aggregation of Sum or Count.Note: The Percent of Subtotals derived item is available only for crosstabs.Note: The Percent of Subtotals derived item is relative to the subset of data that is selected by your filters and ranks.Displays the percentage of the total value for the measure on which it is based. You can create a percentage of total only when the source data item has an aggregation of Sum or Count. For example, you might create the percentage of the total value for a measure that contains revenue values. If you create a bar chart of the aggregated measure and a category that contains product lines, then the bar chart shows the percentage of total revenue for each product line.Note: The percentage of the total value is relative to the subset of data that is selected by your filters and ranks.Displays the aggregated value for the current time period and all of the previous time periods within a larger time interval. For example, you might derive the year-to-date total for each month.Note: This derived item is not available if your data source does not contain a date data item that includes the year.Displays the aggregated value for the current time period and all of the previous time periods within the year. For example, you might derive the year-to-date total for each month.The year-to-date calculation subsets the data for each year using today’s date (where today is evaluated each time you view the report). To use all data for every period, edit the expression for the derived item.Note: This derived item is not available if your data source does not contain a date data item that includes the year.Displays the percentage difference between the year-to-date value for the current time period and the year-to-date value for the same time period of the previous year. For example, you might derive the difference in year-to-date sales between the current month and the same month of the previous year.The year-to-date calculation subsets the data for each year using today’s date (where today is evaluated each time you view the report). To use all data for every period, use a Period to Date item or edit the expression for the derived item.For the month that contains today’s date, the data for an earlier year is subset to the same corresponding date.Note: This derived item is not available if your data source does not contain a date data item that includes the year.Displays the percentage difference between the current time period and an equivalent time period from the previous year. For example, you might derive the difference in sales between the current month and the same month of the previous year.The year-over-year growth calculation subsets the data for each year using today’s date (where today is evaluated each time you view the report). To display a percentage of growth using full periods, use Percent Difference from Previous Parallel Period or edit the generated formula.For the month that contains today’s date, the data for an earlier year is subset to the same corresponding date.Note: This derived item is not available if your data source does not contain a date data item that includes the year.
Alternatively, you can
use the Data tab to create derived data items.
Create a Percentage of Total Using the Data Tab
A measure is required
to have a Sum or Count aggregation before you can create a percentage
of total.
To create a percentage
of total from a measure data item using the Data tab:
-
On the Data tab in the left pane, right-click on the measure data item that you want to use for the percentage of total.
-
Select Create
 Percent of Total.
The percentage of total measure data item appears in the list of aggregated data items with a name that is derived from the original name. For example, if the original measure data item name is
Percent of Total.
The percentage of total measure data item appears in the list of aggregated data items with a name that is derived from the original name. For example, if the original measure data item name isRevenue, then the percentage of total measure data item is displayed asRevenue (Percent of Total). The icon identifies the new percentage of total measure
data item on the Data tab.
Create a Custom Category
You can create a custom category based on either a category or measure data item. A custom category data item is always
a category data item with an alphanumeric value.
When you create a custom category from a measure, you can use intervals, ranges, or
specific values to group the data.
Tip
The labels for your custom
categories must use characters that are compatible with the locale
of the data source. If the data source uses Unicode, then your labels
can contain characters from any locale.
To create a custom
category:
-
On the Data tab, right-click on the category or measure data item that you want to use to create the new custom category. Select New Custom Category. The New Custom Category window is displayed.
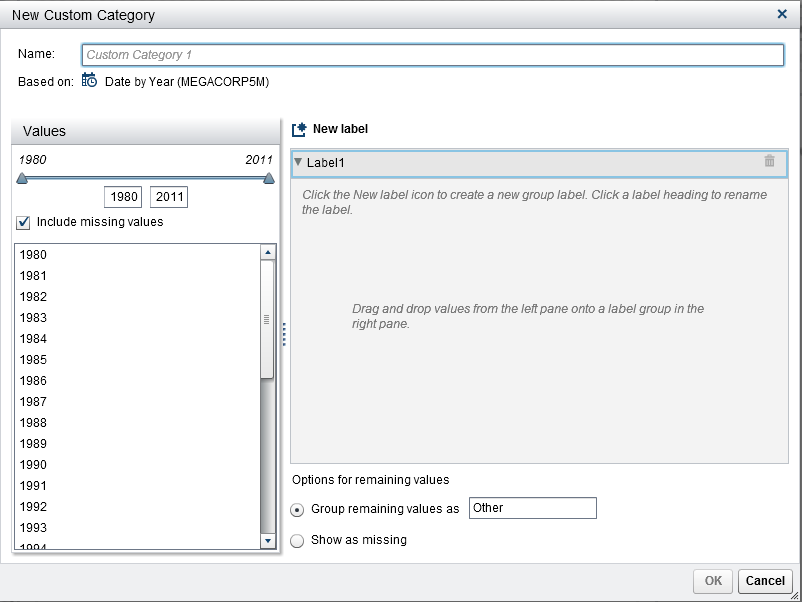 Note: In the New Custom Category window, Based on identifies the type and the name of the data item that the custom category is based on.
 -
Select the Values that you want to include. Drag and drop the values onto the right pane under New label.
TipTo rename a custom group label, right-click the label name, and select Edit.
-
(Optional) Specify the Options for remaining values. You can specify a name when you select Group remaining values as. The default label for Group remaining values as is
Other. Alternatively, you can specify Show as missing or Show as is.Note: The Show as is option is available only for data items that are based on string categories. It is not available for numeric or date values. -
Specify a Name for the new custom category. The default name is
CustomCategory1. -
Click OK. The new custom category is displayed on the Data tab.
Modify Data Item Properties
Rename a Data Item
To rename a data item:
-
Select a data item on the Data tab.
-
In the data item table, select the existing name for the data item, and then enter a new name. The name cannot be used by another data item in the same data source. Your change is saved automatically.
Alternatively, you can right-click the data item, and select Rename Data Item.
Modify a Data Item’s Classification
You can modify a data item’s classification. For example, you might want to modify
a measure data item to be a category data item. A data item’s classification cannot
be modified if that data item is in use in the
report or if the data item can have one classification only. However, duplicating
the data item allows the new data item to have a different classification.
Here are some key points about modifying a data item’s classification:
-
You can modify a category data item to be a measure data item only if the data item started as a numeric measure. For example, if you change a measure to a category in the report, then the designer allows you to change it back to a measure. In addition, you can change a category to a measure if it was originally in the data source as a numeric column. In this case, your data administrator converted the numeric column to a character string by applying a user-defined format. As a result, you can use the designer to change the category’s format to one of the standard numeric formats, and then you can change it to a measure.
-
You cannot change the classification for the frequency data item or the frequency percent data item.
-
You cannot change the classification for an aggregated measure.
-
You cannot convert calculated data items into geography data items.
Tip
For geography data items,
use the pop-up menu instead of the drop-down menu to change the classification.
The pop-up menu enables you to specify additional classification information
for the geography data item.
To modify a data item’s
classification:
-
Select a data item on the Data tab.
-
In the data item table, select the existing classification for the data item.
-
Modify the Format of a Numeric Measure Data Item or a Date, Datetime, or Time Data Item
You can modify the format of a numeric measure data item or a date, datetime, or time
data item. You can also modify the format of a data item with a user-defined format
as long as the user-defined format is based on an underlying numeric value. For more information
about user-defined formats, see Modify User-Defined Formats.
Here are some key points about modifying a data item’s format:
-
You cannot modify the format of a data item that is being used in a filter, as part of a calculated or aggregated measure, or in a custom category.
-
For line charts with multiple measures, formats are removed from all of the measure labels if the formats are different.
To change the format:
-
Select a data item on the Data tab.
-
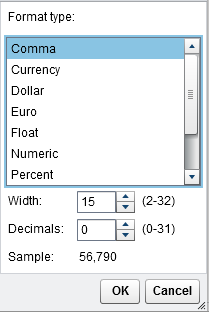
In the data item table, select the existing format. A list is displayed with the Format type, Width, and Decimals (for numeric data items). Make your selections. A sample of your selection is displayed under the list.Note: There are different format variations available for some format types for date, datetime, and time data items. Select the format variation based on the sample value displayed in the Format drop-down list.Here is an example of the list for a numeric data item:
 Here is an example of the list for a date data item:
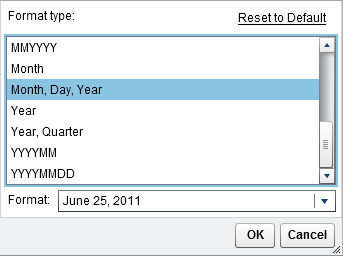 Note: The Reset to Default option is displayed only if the format has been changed from the default.Note: The Reset to Default option is available for user-defined format data items after they have been modified to a standard numeric format as long as the data item is still a category data item.
 -
Click OK to save your changes.
Modify User-Defined Formats
In the designer, user-defined formats that are defined in the SAS LASR Analytic Server are applied to the results. You
can change the format for an underlying numeric data item, but you cannot change the
format for an underlying character-based data item. If you change the format for an
underlying numeric data item, you can restore the user-defined format by selecting
Reset to Default.
The Format property of the data item displays the name for a user-defined format.
The icon identifies a category data item with an active user-defined format on the Data tab.
icon identifies a category data item with an active user-defined format on the Data tab.
Modify How a Measure Is Aggregated
You can change the aggregation method for a measure in a data source using the Data tab
or a report object in the canvas.
Note: You need to understand your
data because some aggregation methods are not always appropriate.
For example, an average of an average is not valid.
To change the aggregation
method using the Data tab:
-
Select a measure data item on the Data tab.
-
In the data item table, select the existing aggregation, and then click
 . A drop-down list is displayed with aggregations. For a list of the available
aggregation types, see Aggregations for Measures.When you select an aggregation, your change is saved automatically.Note: All of the report objects in the report that use this data item are affected by this change unless you have selected a local aggregation override.Note: Depending on the aggregation, formats might be overridden when they are used in report objects. For example, skewness becomes a floating point number with four decimals.
. A drop-down list is displayed with aggregations. For a list of the available
aggregation types, see Aggregations for Measures.When you select an aggregation, your change is saved automatically.Note: All of the report objects in the report that use this data item are affected by this change unless you have selected a local aggregation override.Note: Depending on the aggregation, formats might be overridden when they are used in report objects. For example, skewness becomes a floating point number with four decimals.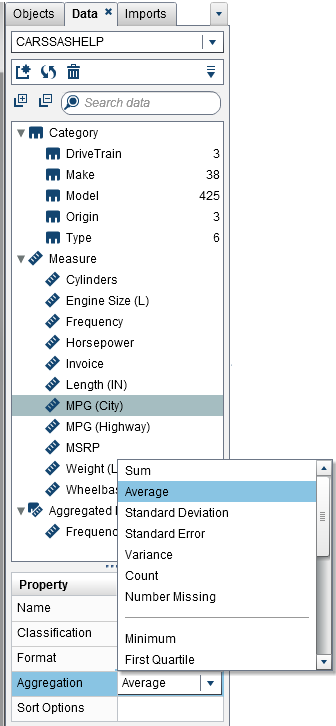
To change the aggregation
method when you are working with a report object in the canvas:
-
Choose one of the following:
-
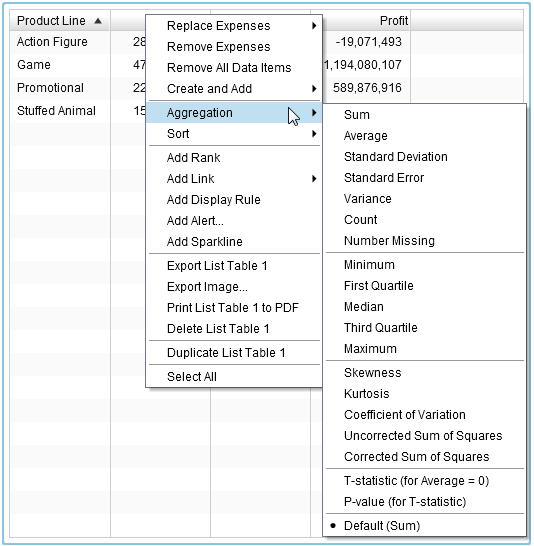
For a list table, right-click on a measure header in the report object.
-
For a crosstab, right-click on the header row with the measure. Depending on the aggregation, formats might be overridden when they are used in a crosstab.
-
For a graph, right-click on the measure name hotspot. Or, you can right-click on a measure data item name on the Roles tab.
-
-
Select Aggregation<aggregation-name>, where
aggregation-nameis one of the available aggregations. For a description of the available aggregation types, see Aggregations for Measures.Your change is saved automatically.Note: This is a local override for only this report object. It does not affect the default aggregation for this data item in other report objects.
Modify the Sort Options for a Category Data Item
Using the data item table on the Data tab, you can change the Sort Options for a category data item with a user-defined format that is based on an underlying
numeric value. The sort options are the following:
Formatted
Uses the formatted character output of the user-defined format and sorts lexically.
(For example, the names of the months in the year would sort
as April, August, December, February, and so on.) Formatted is the default.
Unformatted
Uses the underlying numeric value and sorts numerically. (For example, if the underlying
numeric value for January
is 1, for February is 2, for March is 3, and for April is 4, then the months of the
year would sort as January, February, March, April, and so on.)
Delete Data Items
You can delete data
items that you have created in the designer (for example, calculated
data items or duplicated data items) so that they no longer appear
on the Data tab in the left pane.
You cannot delete a data item that is inside a hierarchy if it reduces the hierarchy
to a single level. You cannot
delete a data item if it is the last or only reference to a column in the original
data source. You cannot delete a data item if it is used in a calculated data item,
aggregated measure, a geography data item, or a custom category.
Tip
You can hide a data item that
you cannot delete by right-clicking on the data item name in the Data tab,
and then selecting Hide Data Item. For more information,
see Show or Hide Data Items on the Data Tab.To delete a data item:
-
On the Data tab in the left pane, right-click the data item that you want to delete.
-
Select Delete Data Item.
-
Click Delete in the confirmation message that is displayed. The data item is removed from the list of data items, as well as from any report objects, filters, or ranks that were using it.
Copyright © SAS Institute Inc. All Rights Reserved.
Last updated: January 8, 2019