Example: Using Parameters in a Report
You can use parameters
to design complex reports. Here is an example of a complex report
with parameters:
Example: A Report with Parameters
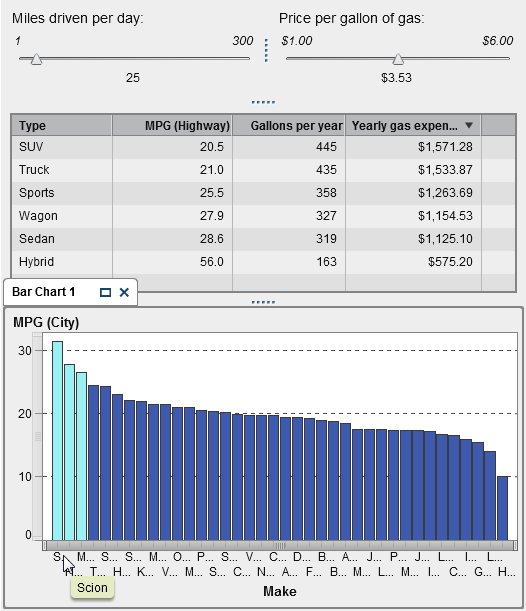
The report has two sliders, a list table, and a bar chart. One slider lets you adjust the number of miles that you drive each day. The other slider lets
you adjust the price per gallon of gasoline. The results of the selections in the
sliders are calculated, and the values are used in a calculated data item that is displayed in the list table. For example, you can see what happens to the
list table when you change the parameter for Miles
driven per day from 25 to 100.
The values of the calculated data item are also used in the bar chart. The bar chart
has a display rule, (MPG (City) > Miles per day),
so that vehicles that have a fuel economy value that is better than
the number of miles that you drive per day are highlighted.
Copyright © SAS Institute Inc. All Rights Reserved.
Last updated: January 8, 2019