Use the Combine Excluded Rows (or Cells) into “All Other” Properties
You can use the Combine
excluded rows into “All Other” property
for list tables or the Combine excluded cells into “All
Other” property for some graphs. These properties
combine content across categories (for example, the content that is
formed by combining the report object’s visible categories).
These properties are frequently used with filters and ranks.
The effect of these
properties can be influenced by certain types of interactions. For
example, if you have a list table with a Sales measure data item, the list table might have the Combine excluded
rows into “All Other” property selected and be targeted by a slider showing a range of Sales figures. The category combinations that are dropped based on the range selected in
the slider control are grouped into a category named "All Other."
Here are some key points
about the Combine excluded rows into “All Other” and
the Combine excluded cells into “All Other” properties:
-
The Combine excluded rows into “All Other” property is not available for crosstabs.
-
The Combine excluded cells into “All Other” property is not available for time series plots, bubble plots, scatter plots, step plots, needle plots, geo maps, or word clouds.
-
The Combine excluded cells into “All Other” property is not available for custom graphs if they depend on multiple data definitions. The property might be available for some custom graphs. For example, suppose that you have a custom graph with a bar chart and a line chart side by side, and the category and measure data role assignments for each chart are shared between the charts. Since one query produces the results for both charts, the Combine excluded cells into “All Other” property is available.
There is a similar, but distinct per-category “All Other” option that is provided
for ranking in the designer. For more information
about the All Other concept for ranking, see Add a New Rank.
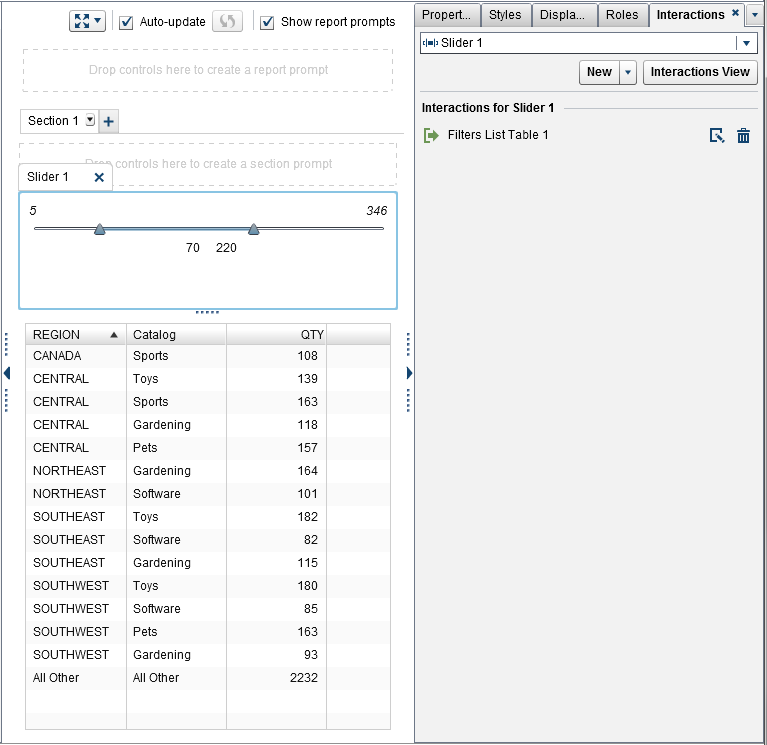
The following list table
shows how the content of combining visible categories is factored
into “All Other”. The list table has two categories
and a measure. The Combine excluded rows into “All
Other” property is selected on the Properties tab. The list table is filtered by aggregate quantity values using the adjacent slider control.
Here are some key points
about the Combine excluded rows into “All Other” property
and the Combine excluded cells into “All Other” property:
-
The property cannot be set when the report object is displaying detail data.
-
The property cannot be set when the report object includes a rank with the per-category All Other option selected.
-
The property cannot be set for pie charts when the Create “Other” slice for minimal values property is selected.
-
The property cannot be set when a hierarchy is assigned to the report object.
-
The property cannot be set for line charts that are imported from the explorer.
Copyright © SAS Institute Inc. All Rights Reserved.
Last updated: January 8, 2019