Adding Table-Level Display Rules
You can add three different types of display rules
to tables. You cannot create a display rule to highlight dates in
a table.
Add Display Rules to a List Table Using an Expression
To specify a new display
rule for a table using an expression:
-
If it is not already selected, select the table in the canvas that you want to update.
-
In the right pane, click the Display Rules tab. Click New. The Add New Display Rule window is displayed.
-
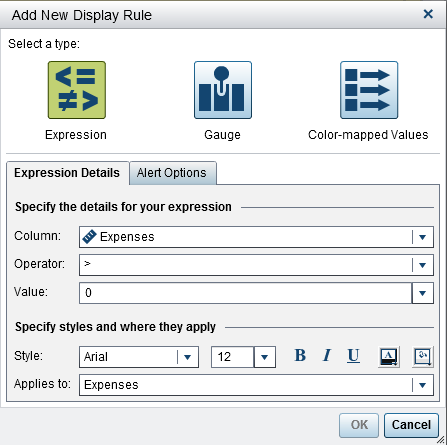
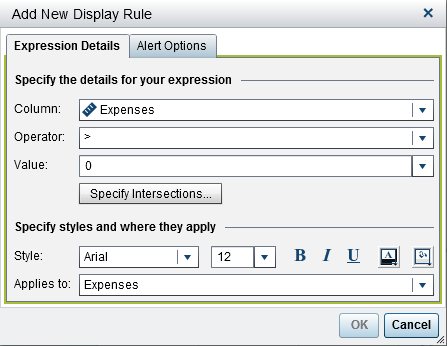
Click Expression. The Add New Display Rule window expands to show the details for the expression.
-
On the Expression Details tab, select the Column or any measure value.
-
Select the Operator. You can select =, < >, BetweenInclusive, <, <=, >, >=, Missing, or NotMissing. The default is >.
-
Enter or select a Value.
-
Modify the style, size, and color of the font. There is no default style for list table display rules. You must specify a style to enable the OK button in the Add New Display Rule window.
-
Select the row or column in the Applies to drop-down list.
-
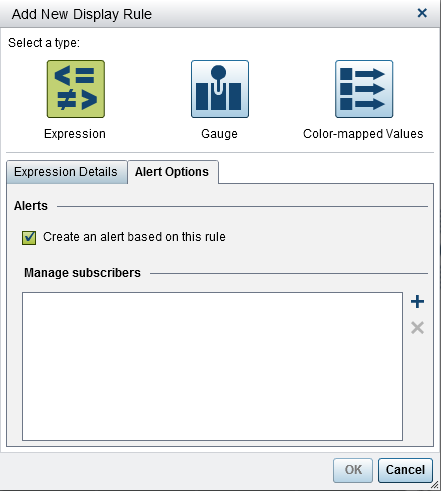
(Optional) On the Alert Options tab, select the Create an alert based on this rule check box. For more information about alerts, see Working with Alerts for Report Objects.
-
Click
 beside the Manage subscribers list to add users who you want notified when the alert condition is met. The Add Recipients window is displayed.
-
Select one or more users. Click OK to return to the Add New Display Rule window.Note: A user’s e-mail address must be stored in metadata to be displayed on the View All tab in the Add Recipients window.
-
-
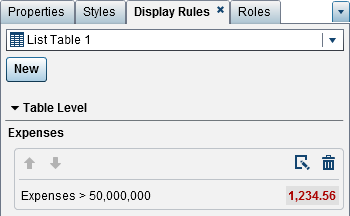
Click OK. The table updates with the new display rule. The display rule appears on the Display Rules tab in the right pane.Here is an example of a display rule that uses an expression:
-
(Optional) Click
 on the Display Rules tab
to edit the new display rule.
on the Display Rules tab
to edit the new display rule.
Add Display Rules to a List Table Using a Gauge
To specify a new display
rule for a table using a gauge:
-
If it is not already selected, select the table in the canvas that you want to update.
-
In the right pane, click the Display Rules tab. Click New. The Add New Display Rule window is displayed.
-
-
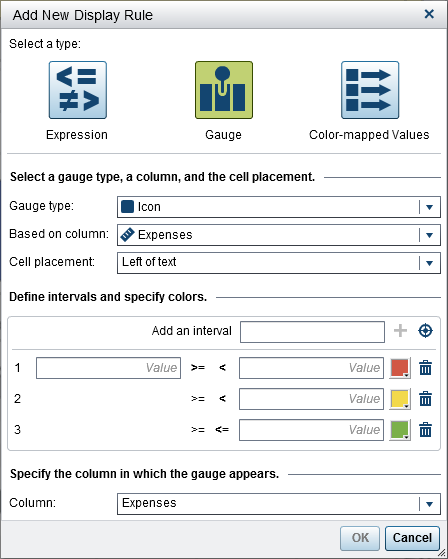
Select a Gauge type from the drop-down list. Your choices are a bullet, an icon, a slider, or a thermometer. Icon is the default.
-
Using the Based on column drop-down list, specify which column the rule should be based on in the report.
-
Specify where the gauge should appear in the column for the Cell placement. Your choices are Left of text, Right of text, or Replace text.
-
Define the intervals and colors for the rule:
-
Enter the individual values for the intervals and then select a color. You can click the operator between the intervals to change it.
-
-
-
Specify the Column in which you want the gauge to be displayed
-
Click OK. The table updates with the new display rule. The display rule appears on the Display Rules tab in the right pane.Here is an example of an automatically populated display rule that uses an icon:
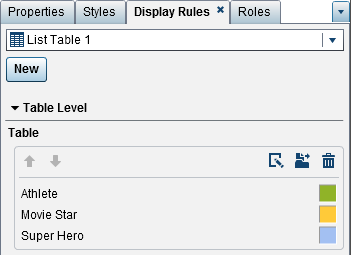
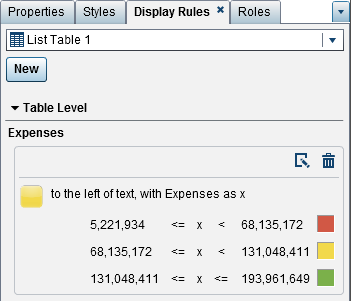 Here is a list table with the display rules applied:
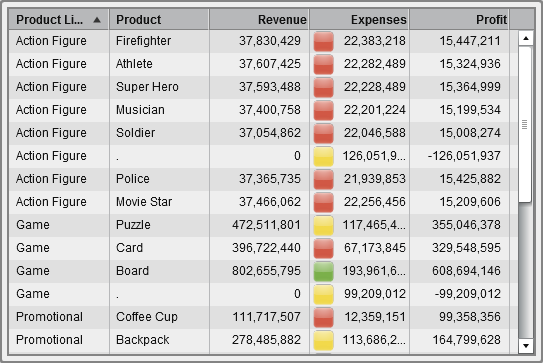 Note: If a value falls outside the bounds of the display rule intervals, no icon is displayed in the list table
 -
(Optional) Click on the Display Rules tab
to edit the new display rule.

Add Display Rules to a List Table Using Color-Mapped Values
To specify a new display
rule for a list table using color-mapped values:
-
If it is not already selected, select the list table in the canvas that you want to update.
-
In the right pane, click the Display Rules tab. Click New. The Add New Display Rule window is displayed.
-
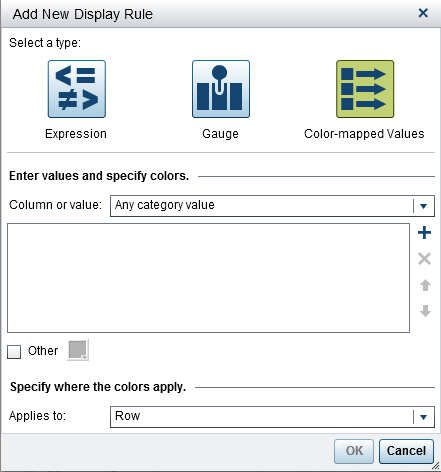
Click Color-mapped Values. The Add New Display Rule window expands to show the details for the color-mapped values.
-
Select the Column or value to which you want to apply the display rule.Note: Color-mapped values for a report object can be applied only to category data items.Note: Color-mapped values cannot be applied to date or datetime data items.
-
Click in the box to enter a value for the display rule.
-
Select a color for the display rule.
-
(Optional) Repeat the steps for entering a value and selecting a color.
-
(Optional) Select the Other check box. Then, select a color.
-
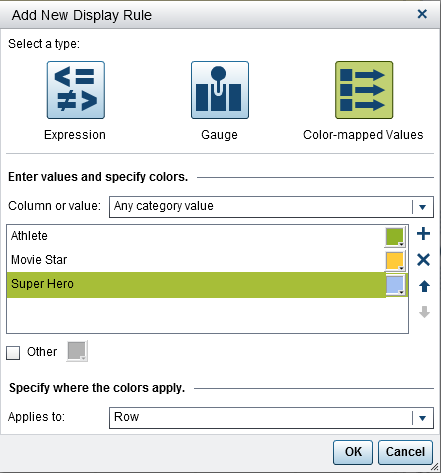
Using the list, specify where you want to apply the colors.In the following example, values and colors have been specified for products in a list table.
-
Click OK. The table updates with the display rules.The display rule appears on the Display Rules tab in the right pane.
-
(Optional) Click
 on the Display Rules tab to change the table-level display rule to a report-level display rule.
Add Display Rules to a Crosstab
To specify a new display
rule for a crosstab using an expression:
-
If it is not already selected, select the crosstab in the canvas that you want to update.
-
In the right pane, click the Display Rules tab. Click New. The Add New Display Rule window is displayed.
-
On the Expression Details tab, select the Column or any measure value.
-
Select the Operator. You can select =, < >, BetweenInclusive, <, <=, >, >=, Missing, or NotMissing. The default is >.
-
Enter or select a Value.
-
If your crosstab contains a hierarchy, then you can specify the hierarchy levels in which the display rule is applied.
-
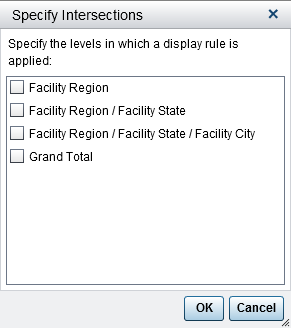
Click Specify Intersections. The Specify Intersections window is displayed.
-
Select one or more hierarchy levels, the grand total, or all of the levels. Click OK to return to the Add New Display Rule window. The intersections that you selected are displayed above the Edit Intersections button.
-
-
Modify the style, size, and color of the font.
-
Select the row or column in the Applies to drop-down list. For crosstabs, the Applies to drop-down list displays only the measures that have been added to the crosstab. There are no row or column options.
-
(Optional) On the Alert Options tab, select the Create an alert based on this rule check box. For more information about alerts, see Working with Alerts for Report Objects.
-
Click beside the Manage subscribers list to add users who you want notified when the alert condition is met. The Add Recipients window is displayed.
-
Select one or more users. Click OK to return to the Add New Display Rule window.Note: A user’s e-mail address must be stored in metadata to be displayed on the View All tab in the Add Recipients window.
-
-
Click OK. The crosstab updates with the new display rule. The display rule appears on the Display Rules tab in the right pane.
-
(Optional) Click on the Display Rules tab
to edit the new display rule.
Copyright © SAS Institute Inc. All Rights Reserved.
Last updated: January 8, 2019