Working with Decision Trees
About Decision Trees
Note: If SAS Visual Statistics
is licensed at your site, then the decision tree contains advanced
features. See Decision Trees.
A decision tree uses the values of one or more predictor data items to predict the values of a response data item. A decision tree displays a series of nodes as a tree, where the top node is the response data item, and each branch of the tree represents a split in the values of a predictor data item. Decision trees
are also known as classification and regression trees.
Example Decision Tree
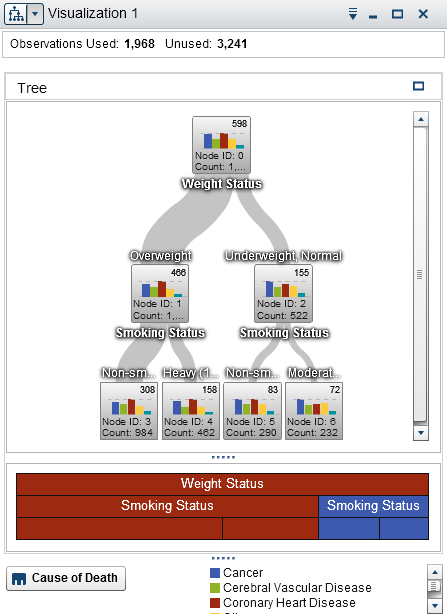
Each branch of the tree displays the name of the predictor for the branch at the top
of the split. The thickness of the branch indicates the
number of values that are associated with each node. The predictor values for each
node are displayed above the node.
Each node in the tree displays the data for the node either as a histogram (if the
response contains continuous
data) or as a bar chart (if the response contains discrete data). The histogram or bar chart in each node displays the values of the response data
item that are selected by the splits in the tree. The number at the top right of the
node
indicates the greatest value or frequency for the bar chart or histogram. At the bottom
of each node, the total number of data values (count) for the node is displayed.
Below the decision tree, an icicle plot of the nodes is displayed. The color of the node in the icicle plot indicates the predicted level for that node. When you select a node in either the
decision tree or the icicle plot, the corresponding node is selected in the other
location.
Decision trees in SAS
Visual Analytics use a modified version of the C4.5 algorithm.
The details table for a decision tree contains two additional data columns, Node ID
and Parent ID. Node ID specifies a
unique value for each node in the tree. Parent ID specifies the ID of the parent node.
Data Roles for a Decision Tree
The basic data roles for a decision tree are:
Response
specifies the response for the decision tree. You can specify any category or measure.
The decision tree attempts to predict the values of the response data item. The bar
chart or histogram inside each node of the tree displays the frequency of values for
the response data item.
Predictors
specifies predictors for the decision tree. You can specify one or more categories
or measures as predictors. The values of
predictor data items are displayed above the nodes in the tree. The order of the data
items in the Predictors list
does not affect the tree.
Note: If a predictor does not contribute
to the predictive accuracy of the tree or the contribution has been
pruned, then the predictor is not included in the final tree that
is displayed.
Specify Properties for a Decision Tree
On the Properties tab,
you can specify the following options:
Name
specifies the name of the visualization.
specifies whether missing values are included in the tree.
Frequency
specifies whether the frequency value for each node is displayed as a count (Count)
or as a percentage (Percent).
Note: The frequency values are
based on the data that is shown in the visualization (after filters
and other data selections have been applied).
specifies the parameters that are used to create the decision tree. Select one of
the following values:
Basic
specifies a simple tree with a maximum of two branches per split and a maximum of
six levels. For
details, see Parameter Values for the Basic and Advanced Growth Strategies.
Advanced
specifies a complex tree with a maximum of four branches per split and a maximum of
six levels. For
details, see Parameter Values for the Basic and Advanced Growth Strategies.
Custom
enables you to select
the values for each of the parameters.
If you select Custom as
the value for Growth strategy, then the following
additional options appear:
specifies the maximum number of branches for each node split.
specifies the maximum number of levels in the tree.
specifies the minimum number of values (count) for each node.
specifies the number of bins that are used for the response data item.
Note: This option has no effect
if the response data item contains discrete data.
specifies the number of bins that are used for predictor data items.
Note: This option has no effect
if the predictor data items contain discrete data.
enables you to use the information gain ratio and k-means fast search methods for decision tree growth. When disabled, the information gain and greedy search methods are used, which generally produce a larger tree and require
more time to create.
Pruning
specifies the level of pruning that is applied to the tree. Pruning removes leaves and branches that contribute
the least to the predictive accuracy of the tree. A more Lenient pruning value specifies
that fewer leaves and branches are removed from the tree. A more Aggressive pruning
value specifies that more leaves and branches are removed from the
tree.
specifies that predictors can be used more than once in the tree.
The following parameter
values are used for the Basic and Advanced growth
strategies:
|
Property
|
Basic Value
|
Advanced Value
|
|---|---|---|
|
Maximum branches
|
2
|
4
|
|
Maximum levels
|
6
|
6
|
|
Leaf size
|
1
|
1
|
|
Response bins
|
10
|
10
|
|
Predictor bins
|
2
|
10
|
|
Reuse predictors
|
No
|
Yes
|
Explore a Node as a New Visualization
For each node in the tree, you can explore the data values as a new histogram or bar
chart visualization. To create a new visualization for a node, right-click on the node, and then select Create Visualization from
Node. A new visualization appears.
Note: If you create a visualization
from a node that displays a histogram, then the new histogram might
have visual differences from the histogram that is displayed in the
decision tree. For example, the bins and the extent of data on the
X axis might be different. However, the two histograms use exactly
the same data.
Derive a Leaf ID Data Item from a Decision Tree
You can derive a leaf ID data item to represent the results of a decision tree. The leaf ID data item creates
values that correspond to the node IDs in the details table for the decision tree.
You can use the leaf ID data item in a filter to select the values for a decision tree node in other types of visualizations.
To calculate a leaf
ID data item from a decision tree:
-
Select the
 drop-down list from the visualization toolbar, and then select Derive a Leaf ID Variable.
-
In the New Calculated Item window, enter a Name for the new calculated item.
-
Click OK to create the new data item.
Display the Overview
For large decision trees, the overview enables you to select the portions of the tree
that are visible.
To display the overview, right-click an empty part of the decision tree, and then
select Show
Overview.
Note: Each leaf node in the overview
displays a single bar for the greatest value in that node. To display
a bar for each node in the overview, right-click an empty part of
the decision tree, and then select Show Branch Coloring.
Zoom a Decision Tree
You can zoom a decision tree by using either of the following controls:
-
in the overview, select the part of the decision tree that you want to view
-
Note: If you zoom out on the decision
tree, then each leaf node displays a single bar for the greatest value
in that node. To display a bar for each node in the tree, right-click
an empty part of the decision tree, and then select Show
Branch Coloring.
When you have zoomed in on a decision tree and scroll bars are displayed, you can
reposition the decision tree by holding down the Shift and Alt keys and dragging it.
Pan (Scroll) a Decision Tree
You can pan (scroll) the decision tree by using any of the following controls:
-
in the overview, drag the selection box
-
hold down the Shift key and drag the decision tree
Copyright © SAS Institute Inc. All Rights Reserved.
Last updated: January 8, 2019