Model Comparison Results Windows
Assessment
The assessment plots available depend on the models being compared. For classification models, the plots displayed are Lift, ROC, and Misclassification. For numerical models, the plots displayed
are observed response value and predicted response value.
Details Table
When you click the  icon at the top of the model pane, the details panel
is displayed at the bottom of the model pane. The details table contains
the following information:
icon at the top of the model pane, the details panel
is displayed at the bottom of the model pane. The details table contains
the following information:
icon at the top of the model pane, the details panel
is displayed at the bottom of the model pane. The details table contains
the following information:
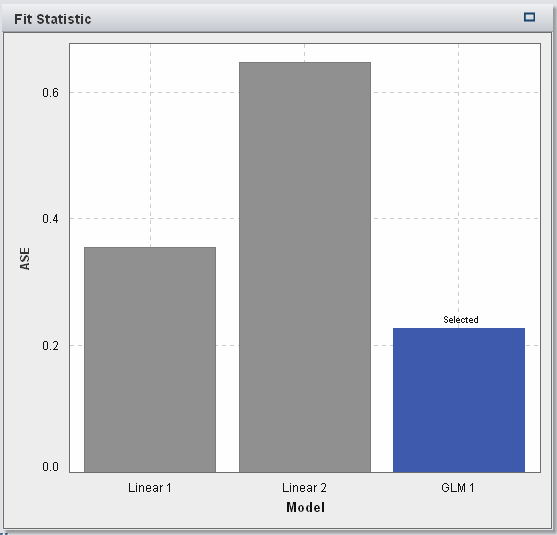
Statistics
Provides summary statistics for each model in the comparison. The value in the Selected column,
either Yes or No, indicates which model the model comparison tool prefers based on the criterion specified in the Fit statistic property.
However, the statistics listed in the details table can differ from
those listed in the Fit statistic property.
Variable Importance
Indicates which variables
had the greatest impact on each of the models in the comparison.
Copyright © SAS Institute Inc. All rights reserved.