Using Custom Graphs to Display Results
About Custom Graphs
The graph builder enables
you to create custom graph objects. To access the graph builder, on
the Objects tab, click  . The Create Custom Graph window
is displayed. For more information,
see Creating and Using Custom Graph Objects.
. The Create Custom Graph window
is displayed. For more information,
see Creating and Using Custom Graph Objects.
. The Create Custom Graph window
is displayed. For more information,
see Creating and Using Custom Graph Objects.When a custom graph
is saved in the My Folder location,
it is displayed under the Custom heading
on the Objects tab. Then, you can insert
the custom graph into a report and add data to it. For information
about adding a custom graph to the Objects tab,
see Show or Hide Report Objects in the Objects Tab.
For a definition and a
picture of each custom graph type, see Graphs, Charts, and Plots.
Specify Custom Graph Properties
To specify the properties
for custom graphs:
-
Update the general properties for the graph. You can update the Name, Title, Format (for the title’s font style), and Description.
-
Update the specific properties for the graph. The available properties depend on the selected custom graph type.By default, the Enable selection in the viewers property is selected for custom graphs. This means that users who use the web viewer or a mobile device can select the custom graph and click
 to see the custom graph name and any incoming filter
information.
Note: No properties are available for the schedule chart.
to see the custom graph name and any incoming filter
information.
Note: No properties are available for the schedule chart.
Specify Custom Graph Styles
To specify styles for
custom graphs:
-
Update the styles for the graph. The available styles depend on the selected custom graph type. For example, you can specify Border and Fill, Data Styling, Frame Styling, Text Styling, and Data Colors for custom graphs.By default, the background of a graph is set to white. Use the Wall background option (under Frame Styling) to specify a different color.Note: A three-color Gradient data color style is available for custom graphs that have a Color role.
Your custom colors are saved between SAS Visual Analytics sessions. Your custom colors are displayed in the color palette. For an example
of the color palette, see A Color Palette in the Designer.
Assign Colors to Overlays in Custom Graph Elements
Each time a new graph element is overlaid on top of an existing graph element, the data colors that are assigned
to each subsequent graph element are the colors after all of the colors have been
assigned to the first graph and its elements. If 12 colors are assigned to the first
graph element (for example, a bar chart), then the graph element that is overlaid (for example, a line chart) is assigned color 13.
To have the overlaid graph element start with the first color, change the Overlaid
plot colors property for the cell in the graph builder
to All graphs start with the same color.
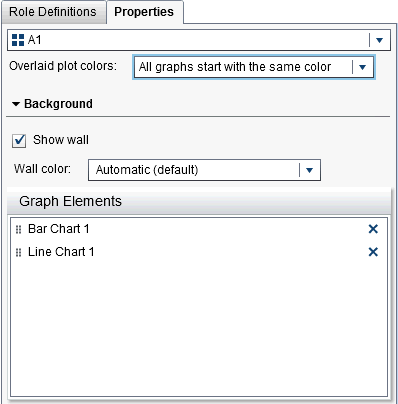
Setting the Overlaid
plot colors property affects the Fill colors
on the Styles tab when you open the custom
graph in the designer.
Data Colors on the Styles Tab in the Designer
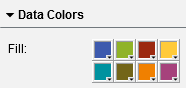
If a custom graph contains
more than eight groupings, the Fill colors
are repeated. Here is the pattern for colors:
|
Colors
|
Pattern
|
|---|---|
|
1-8
|
The colors are specified
in the Fill color palette.
|
|
9-16
|
Repeat colors 1 through
8 in a lighter hue.
|
|
17-24
|
Repeat colors 1 through
8 in a darker hue.
|
|
25-32
|
Repeat colors 1 through
8 in the Fill color palette.
|
|
33-40
|
Repeat colors 1 through
8 in a lighter hue.
|
|
41-48
|
Repeat colors 1 through
8 in a darker hue.
|
|
More than 48 colors
|
Repeat the color patterns
above.
|
Copyright © SAS Institute Inc. All rights reserved.