Creating a Data-Driven Lattice
About Data-Driven Lattices
A data-driven lattice is a multi-cell graph in which the cell data is determined by the values of one or
more class variables. Class variables are specified in the designer when the report
designer creates a report that includes the lattice. The number of cells is determined
by the unique values of the class variables. Each cell of the lattice has the same
graph elements. However, these graph elements have different values of the class variables.
The following example shows a graph with data assigned to it. The custom graph object
includes a data-driven lattice with a columnar role. The graph object allows multiple
data assignments for the Measure role.
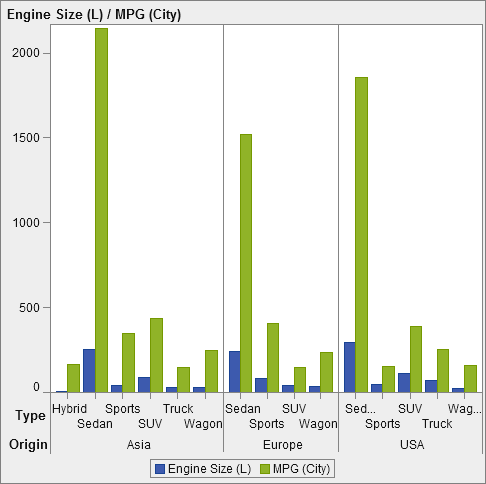
In the report, the graph object includes a three-cell lattice of bar charts showing engine size and miles per gallon for different types of automobiles. The country of origin
is specified as the class variable. As a result, a cell is created for each country
of origin.
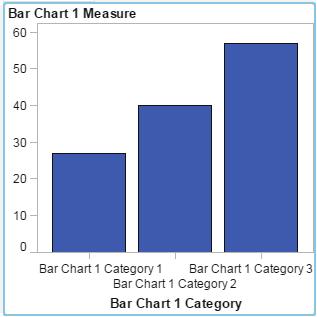
The following example
shows the graph object that was created in the graph builder. The
lattice role was specified for columns.
Here are the characteristics of data-driven lattices:
-
You can define up to two lattice roles: one role for the rows and another role for the columns. When the report designer uses the lattice in a report, the class variables are assigned to the lattice roles. All class variables must come from a single data source. The number of rows and columns in the graph is determined by the unique values of the class variables.
-
If you specify that the role is required, then a report designer must assign data to the role.If this option is not selected, then report designers can choose whether to assign data to the role. In that case, it is possible for a graph object to have no lattice.
-
Graph elements can be overlaid the same way they are overlaid in single-cell or user-defined multi-cell graphs. When the report designer adds a lattice to a report, the overlaid graph element is displayed in every cell.
-
Properties that you specify for graph elements are applied to all of the cells of the graph object.
Create a Data-Driven Lattice
To create a data-driven
lattice:
-
Create the graph object that you want as the basis for your lattice. For more information, see Build a Custom Graph Object.
-
Specify the role for a class variable. In the Data-Driven Lattice section of the Role Definitions tab, click Add Lattice Role.The Add Role window is displayed.The Data-Driven Lattice section is not available in either of the following cases:
-
the graph object already contains more than one cell
-
a Color role with a Measure data type has been added to the bar chart, waterfall chart, or scatter plot
In addition, data-driven lattices do not allow graph elements to be overlaid unless their aggregations are compatible. Graph elements with compatible aggregations either perform no aggregation at all or they use the same set of shared Category roles. -
-
Select the data type, or classification, for the role. For information about the data types, see Working with Data Items in a Report.
-
If the Allow multiple data assignments check box is available, then you can select or clear the check box. When this option is selected, the role can have more than one measure assigned. For example, in a line chart, if multiple columns are assigned to the Y axis, then the graph shows a line for each measure.
Repeat the previous
steps to specify a second role. For example, if you specified a role
for a multi-row layout, you can specify an additional role for columns.
Copyright © SAS Institute Inc. All rights reserved.