Working with Sankey Diagrams
About Sankey Diagrams
A Sankey diagram enables you to perform path analytics. Path analytics displays flows of data from one event (value) to another as a series
of paths.
Parts of a Sankey Diagram
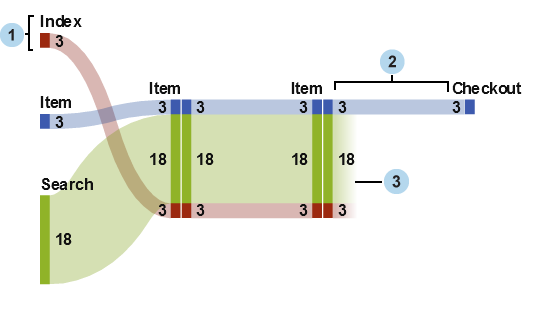
| 1 | Nodes contain the events in each path. The node displays the width of each link that enters and exits the node. The same event can appear at multiple nodes in the diagram. |
| 2 | Links between nodes make up the paths in the diagram. The width of each link can represent either the frequency of the path or the value of a weight measure. |
| 3 | Drop-off links are links that end at the current node. Drop-off links are displayed only if some links continue onward from the current node. |
A path in a Sankey diagram
represents a distinct sequence of events. Each path in the diagram
consists of one or more transactions. A transaction is a sequence
of events that are associated with a specific transaction identifier
value.
For example, if your data contains the activity of visitors to a website, then your
transaction identifier might be the unique session identifier for each visitor. The events in your data might be the individual pages
on the website that the visitor accessed. In this example, each transaction is the
sequence of pages that were accessed by a specific visitor, and each path is a sequence
of pages that contains all of the transactions that follow that sequence.
Data Roles for a Sankey Diagram
Here are the basic data
roles for a Sankey diagram:
Event
specifies a category whose values identify the events that are represented as nodes
in the diagram.
Sequence Order
specifies a datetime data item or a measure whose values identify the order of the events for each transaction.
Transaction Identifier
specifies a data item whose values identify the transactions in the diagram.
Note: The paths in a Sankey diagram
exclude any missing values in the data items that are assigned to
the Event, Transaction Identifier,
or Sequence Order role.
In addition to the basic
data roles, you can specify the following role:
Weight
specifies a measure
for the weight of each event in a transaction. The weight values for
each transaction, for each event in a path are aggregated to determine
the path weight.
Specify Properties for a Sankey Diagram
On the Properties tab,
you can specify the following:
Name
specifies the name of the visualization.
Title
specifies the title
that appears above the graph.
Note: Title is
disabled if you select Generate graph title.
Generate graph title
specifies that the graph title is generated automatically based on the data items in the visualization.
Show labels
displays the event name for each node.
Show nodes
displays link width values at each node.
Show outline
displays a box around each node.
Vertical layout
displays the diagram
vertically.
Link color
specifies the method
that is used to group and color the paths or links in the diagram.
Select one of the following:
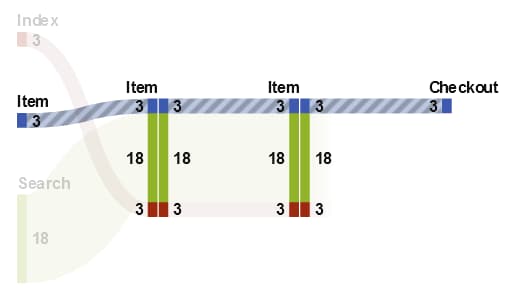
Path
displays each path
as a separate group with a distinct color.
Event
groups links together
by event. Links that originate from the same event have the same color.
For links between the same two events, the links are combined even
if their transactions are part of different paths.
Drop off
groups links together based on whether they are drop-off links. A drop-off link represents
a link that ends at the current node while other links continue onward from the current
node. For links between the same
two events, the links are combined even if their transactions are part of different
paths.
Link width
specifies whether the
width of a link in a path represents the path frequency (Frequency)
or the aggregated value of the weight measure (Weight).
Note: If you do not assign the Weight data
role, then Frequency is always used for the
link width.
Note: If the aggregated value of
the weight measure for any path is negative, zero, or missing, then Frequency is
used for the link width.
Minimum path length
specifies the minimum length for a path that is displayed. The path length that you
specify indicates the number of nodes in the path.
For example, if the Minimum
path length is 3 and the Maximum path length is 5, then the diagram displays only paths that have lengths of 3, 4, or 5 nodes.
Maximum path length
specifies the maximum length for a path that is displayed. The path length that you
specify indicates the number of nodes in the path.
For example, if the Minimum
path length is 3 and the Maximum path length is 5, then the diagram displays only paths that have lengths of 3, 4, or 5 nodes.
Note: A hyphen character ( - )
specifies that there is no maximum path length.
Minimum frequency
specifies the minimum
path frequency for a path that is displayed. For example, if you specify
a minimum path frequency of 5, then the diagram displays only paths
that have a frequency of 5 or greater.
Maximum frequency
specifies the maximum
path frequency for a path that is displayed. For example, if you specify
a maximum path frequency of 10, then the diagram displays only paths
that have a frequency of 10 or fewer.
Note: A hyphen character ( - )
specifies that there is no maximum frequency.
Path ranking
specifies a ranking method for the paths in the diagram. If you specified a measure for the Weight role, then ranking is based on
the aggregated value of the weight measure for each path. If there
is no measure for the Weight role, then ranking
is based on the frequency of each path.
From the drop-down list, select Top to select the paths with
the highest values. Select Bottom to select
the paths with the lowest values. In the text field, enter the number
of paths to select.
By default, path ranking selects the top 200 paths.
Note: If your ranking method reduces
the number of paths that are displayed, then a message appears at
the bottom of the diagram.
Compress
combines repeated,
consecutive events in each path into a single event. If you specified
a measure for the Weight role, then the weight
value for a compressed event is the average of the weight values for
the repeated, consecutive events that were combined.
Note: For all of the options under Path
Analytics, click  to apply your changes.
to apply your changes.
Managing the Path Selection for a Sankey Diagram
About Path Selections
You can subset the paths in a Sankey diagram by creating a path selection. A path selection uses
a set of conditions to select or exclude paths based on the nodes or events in each
path.
Create a New Condition By Using the Add New Condition Window
To create a new condition
by using the Add New Condition window, follow
these steps:
-
In the visualization toolbar, click the
 drop-down list, and then select Add New
Condition. The Add New Condition window
appears.
drop-down list, and then select Add New
Condition. The Add New Condition window
appears.
Tip
You can create a condition
for the path selection when only the Event role
is assigned to the visualization. For large data sources, you might
want to create your path selection before assigning all of the data
roles to avoid long loading times.
Create a New Condition from Selected Nodes
To add a new condition from selected nodes in the diagram, follow these steps:
-
Click the drop-down list, and then select either Include
Only or Exclude, and then select
the condition type. The condition type can be any of the following:
Paths Containing All the Selected Nodesincludes or excludes paths that contain all of the selected nodes. This condition type is based on specific nodes in the diagram, rather than the event values.Paths Containing Any of the Selected Nodesincludes or excludes paths that contain any of the selected nodes. This condition type is based on specific nodes in the diagram, rather than the event values.Paths Containing the Selected Events on Any Nodeincludes or excludes paths that contain any of the selected events, on any node. This condition type is based on the event values of the selected nodes.Paths Starting With the Selected Eventsincludes or excludes paths that start with any of the selected events.Paths Ending With the Selected Eventsincludes or excludes paths that end with any of the selected events.
The new condition appears
on the Path Selection tab of the details
table.
Explore the Transaction Identifier Values for a Path Selection
You can explore the transaction identifier values for your path selection by creating
a new visualization. To create a new visualization from your path selection, perform
either of the following
steps:
-
On the Path Selection tab of the details table, right-click a condition, and then select Create Visualization from All Conditions. All of the conditions in your path selection are used to filter the data in your new visualization.
-
In the Sankey diagram, select one or more nodes, click the drop-down list, select Create New Visualization,
and select a condition for your path selection. For more information,
see Create a New Condition from Selected Nodes.The new condition and any existing conditions are all used to filter the data in your new visualization.
The new visualization appears as a bar chart of the data item assigned to the Transaction
Identifier role. A visualization filter selects all of
the transaction identifier values that correspond to your path selection.
If your Sankey diagram includes a weight measure, then the weight
measure also appears in the bar chart.
Note: You can perform any standard
visualization tasks with the new visualization. For example, you can
add data items and change the visualization type.
Use the Spotlight Tool to View Multiple Data Tips
The spotlight tool enables you to view data tips for all of the nodes that are within a circular area around the cursor.
Click  to enable or disable the spotlight tool.
to enable or disable the spotlight tool.
Zoom a Sankey Diagram
You can zoom a Sankey diagram by using either of the following controls:
-
in the overview, select the part of the diagram that you want to zoom
-
scroll the mouse wheel over the visualization to zoom in or zoom out at the location of the cursor
Pan (Scroll) a Sankey Diagram
You can pan (scroll)
the diagram by using any of the following controls:
-
In the overview, drag the selection box.
-
Hold down the Shift key and drag the diagram.
-
When you have zoomed in on a diagram and scroll bars are displayed, reposition your zoomed view by holding down the Shift and Alt keys and dragging the diagram.
Copyright © SAS Institute Inc. All rights reserved.