Your First Look at the Graph Builder
Graph Builder
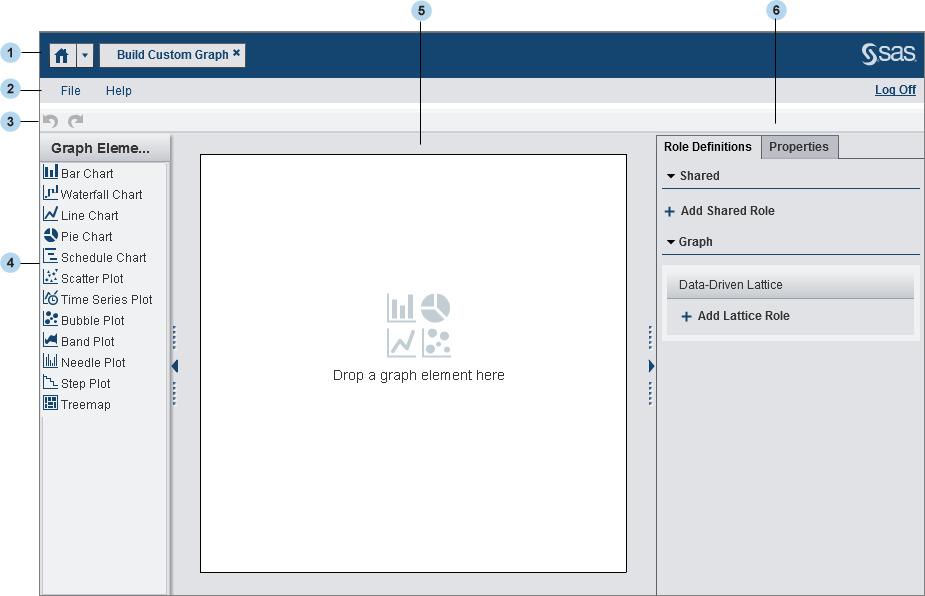
| 1 | The application bar enables you to return to the home page and to access other parts of SAS Visual Analytics and other SAS applications that integrate with the home page. You can access your recently created or viewed reports, explorations, stored processes, data queries, or other objects in your recent history. Buttons are displayed for each open application. |
| 2 | The menu bar enables you to create, open, and save your graph objects. The Help menu provides short how-to topics in addition to this user’s guide. From here, you can log off from SAS Visual Analytics. |
| 3 | The toolbar contains icons that enable you to undo and redo changes to your graph objects. |
| 4 | The left pane contains graph elements that you can drag and drop onto the canvas. |
| 5 | The workspace is where you build a graph object. |
| 6 | The right pane’s tabs enable you to specify data roles, visual properties, and other details of your graph objects. |
Copyright © SAS Institute Inc. All rights reserved.