Using Other Object Types in Reports
Overview of the Other Object Types
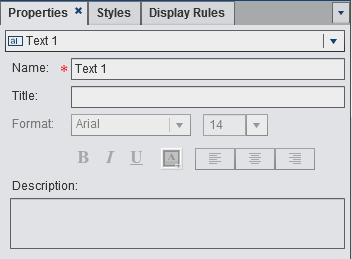
About Text Objects
Text objects display
static text. You can use text to include company standards, such as
text that indicates confidentiality, in your reports. You can have
hyperlinks in text. You can also use text to annotate other objects
in a report. For more information, see Insert Text into a Report.
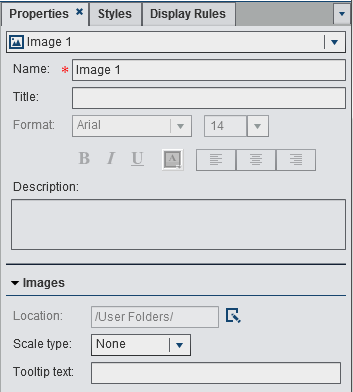
About Images
You can use images to
include your corporate logo or other graphics in your reports. You
can insert images from a repository or from your local machine. If
you select an image from your local machine, it is saved to the repository.
You can also add tooltip text to an image. For more information, see Insert an Image into a Report.
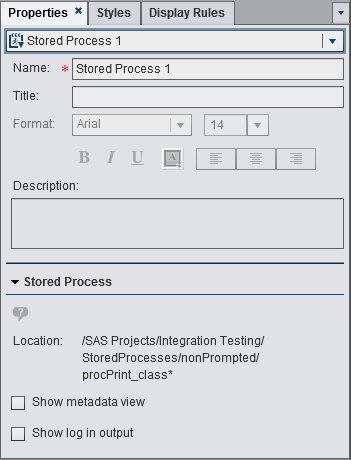
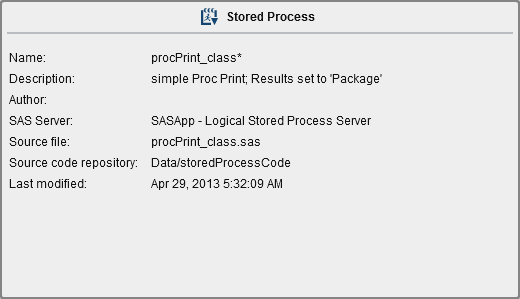
About Stored Processes
A stored
process is a SAS program that is stored on a server
and that can be executed as requested by client applications such
as SAS Visual Analytics. The embedded SAS code can contain instructions
for displaying report elements that include queries, prompted filters,
titles, images, and statistical analyses. For more information, see Insert Stored Processes into a Report.
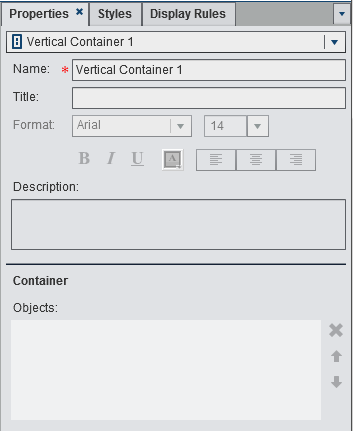
About Vertical or Horizontal Container Objects
You can use a vertical
or horizontal container to group other report objects. For more information, see Insert Vertical or Horizontal Containers into a Report.
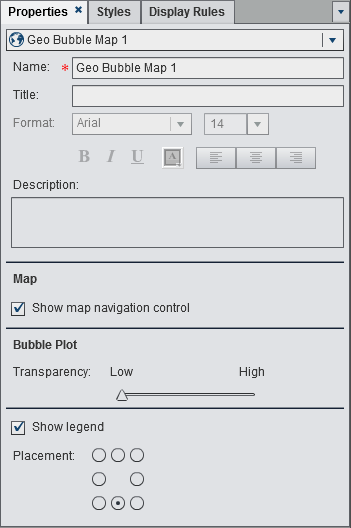
About Geo Bubble Maps
A geo bubble map is
a bubble plot that is overlaid on a geographic map. Each bubble is
located at a geographic location or at the center of a geographical
region. The bubbles are automatically colored based on the location.
You provide a measure data item that determines the size of the bubble.
A geo bubble map requires a data item that contains geographical information
and is assigned to a geography role.
Many types of data have
a spatial aspect, including demographics, marketing surveys, and customer
addresses. For example, if a user needs to evaluate population data
for U.S. Census tracts, a report designer could display the information
in a table. However, it would be easier and more effective for the
person using the report to see the information in the context of the
geography of the tracts. When evaluating information that has a spatial
component, users might find it easier to recognize relationships and
trends in the data if they see the information in a spatial context.
You can add a geo bubble
map only if the report uses data items from a data source that is
enabled for geographic mapping. A geo bubble map requires a geography
variable with the role type of geography. For more information, see Insert Geo Bubble Maps into a Report.
About Geo Region Maps
A geo region map (also
known as a choropleth map) is a two-dimensional map that uses color
and fill pattern combinations to represent different categories or
levels of magnitude. You can fill geographical boundaries (for example,
a country or a state) on a map with color, based on measure values
that are aggregated to the level defined by a geographical boundary.
You can add a geo region
map only if the report uses data items from a data source that is
enabled for geographic mapping. A geo region map requires a geography
variable with the role type of geography. However, it does not support
custom geography data items.
Insert Text into a Report
To insert text into
a report:
-
Double-click inside the text object in the canvas and enter the text. You can use the floating toolbar to change the font, font size, text color, and text background color. You can also specify whether the text is bold, italic, or underlined and whether it is left-aligned, centered, or right-aligned.

For information
about creating a link from text, see Creating Links.
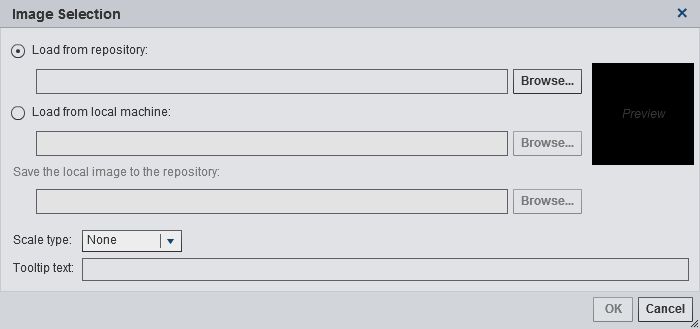
Insert an Image into a Report
To insert an image
into a report:
-
Select the image from one of the following locations:Load from repositorySelect this option to choose an image that is stored on the same server as the reports.Load from local machineSelect this option to choose an image from your local machine. Click Browse to choose a file on your local machine. Specify a repository in the Save the local image to the repository field. If you click Browse, the Save As window is displayed. Select a folder and then click OK to return to the Image Selection window.
-
(Optional) Specify the Scale type:NoneThe actual size of the image is maintained. The image might or might not fill the entire area of the image's visual container. If the image is larger than the visual container, then scroll bars are displayed.StretchThe height and width of image are set to the height and width of the image’s visual container. The image’s original aspect ratio is not maintained.Fit AllThe image is modified to fit best into the image's visual container. The image’s original aspect ratio is maintained.Fit WidthThe width of the image is set to the width of the image's visual container. The height maintains the image's original aspect ratio. Scroll bars are displayed if the set height of the image is greater than the height of the visual container.


Insert Vertical or Horizontal Containers into a Report


Insert Geo Bubble Maps into a Report


Specify Vertical or Horizontal Container Properties
Specify Geo Bubble Map or Geo Region Map Properties
To specify the properties
for a geo bubble map or geo region map:
Copyright © SAS Institute Inc. All rights reserved.