Note: Display rules cannot be added
to crosstabs.
To specify a new display
rule for a table using an expression:
-
If it is not already
selected, select the table in the report canvas that you want to update.
-
In the right pane, click
the
Display Rules tab. Click
New.
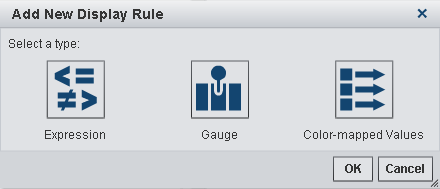
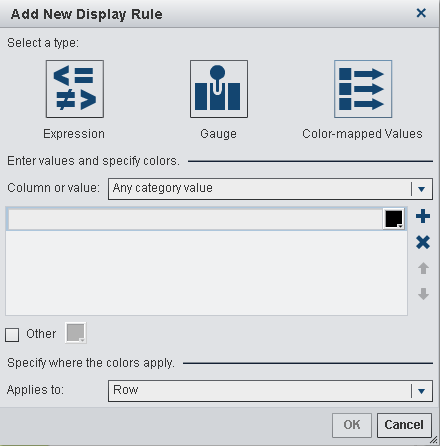
The
Add New Display Rule window is displayed.
Add New Display Rule Window for Tables
-
Click
Expression.
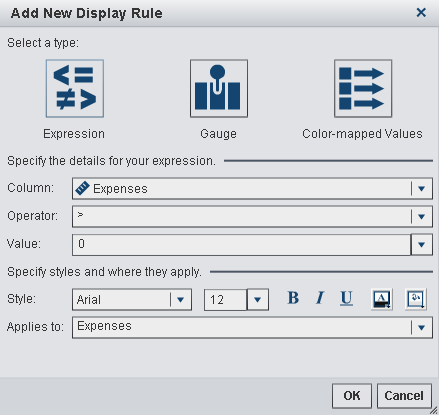
The
Add New Display Rule window expands to
show the details for the expression.
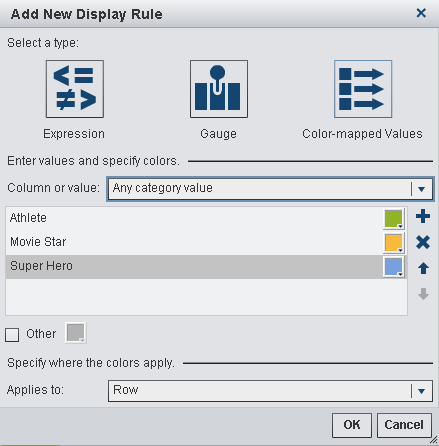
Add New Display Rule Window for an Expression
-
Select the
Column or
any measure value.
-
Select the
Operator.
You can select
=,
< >,
Between,
<,
<=,
>,
>=,
Missing,
or
NotMissing. The default is
>.
-
-
Modify the style, size,
and color of the font.
-
Select the row or column
in the
Applies to drop-down list.
-
Click
OK.
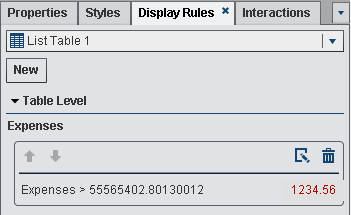
The table updates with the new display rule. The display rule appears
on the
Display Rules tab in the right pane.
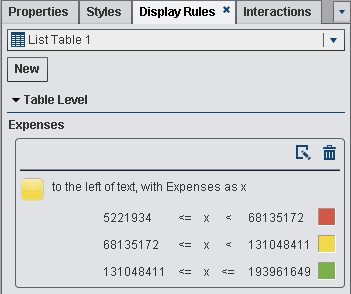
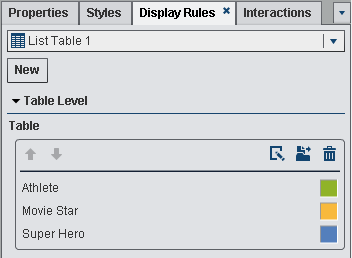
Here is an example
of a display rule that uses an expression:
Display Rules Tab with the Display Rules for an Expression
-
(Optional) Click

on the
Display Rules tab
to edit the new display rule.