Your First Look at SAS Visual Analytics Explorer
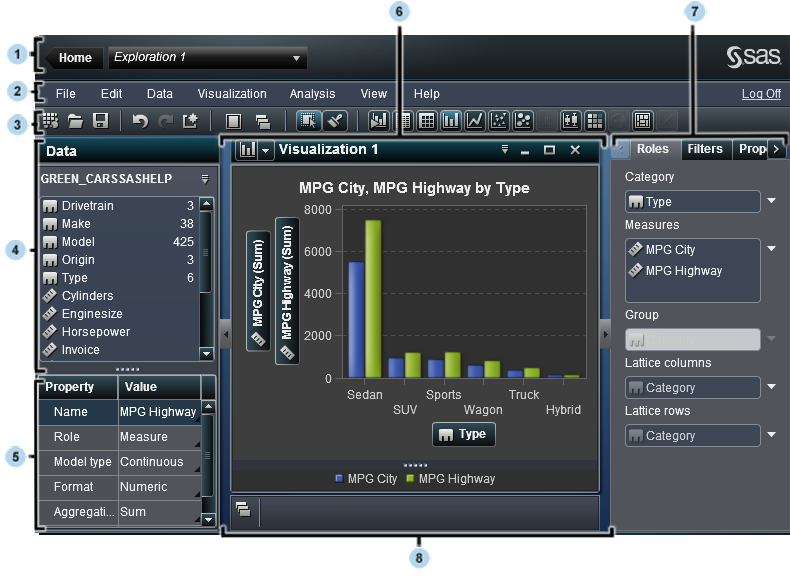
| 1 | The home bar enables you to return to the SAS Visual Analytics Home page and to select from your recent explorations. |
| 2 | The menu bar contains menus that enable you to perform common tasks, such as creating a new exploration and exporting the exploration as a report. |
| 3 | The toolbar contains icons that enable you to manage your explorations and visualizations. |
| 4 | The data pane enables you to manage the data that is used in your visualizations. |
| 5 | The data properties table enables you to manage the properties of the data item that is selected in the data pane |
| 6 | The workspace displays your visualizations. You can view many visualizations at once. |
| 7 | The right pane contains tabs that enable you to change the properties of your current visualization, subset the data that is currently being used, set the data roles for your visualization, and create and view comments. |
| 8 | The dock pane contains any visualizations that you have minimized and enables you to manage your visualizations. |
Copyright © SAS Institute Inc. All rights reserved.