Adding Display Rules to a Gauge
To specify a new display
rule for a gauge:
-
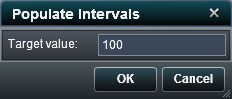
Specify (or modify) the display rules for the gauge. You can populate intervals, edit the display rule, and specify the Type.To automatically populate the intervals:To edit the display rule for a gauge:
-
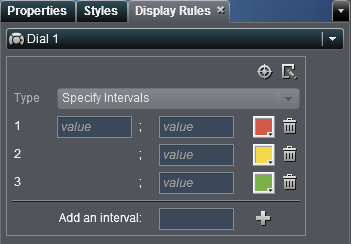
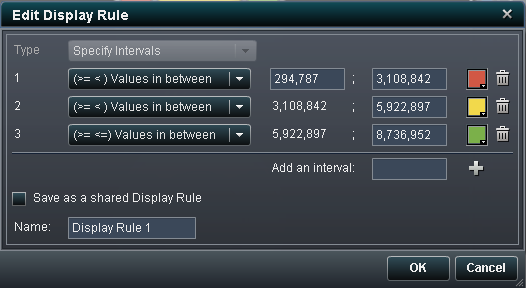
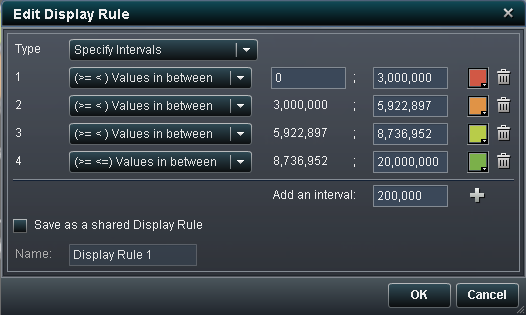
If you select Specify Intervals, then the window contents change so that you can add intervals. Here is an example:Update the conditions for the values, the intervals, and the color for the range. Select a color to open the color picker. To add new intervals to the display rule, enter a number and click Add. Select the Save as a shared Display Rule check box and specify a Name if you want to save the display rule.


Copyright © SAS Institute Inc. All rights reserved.