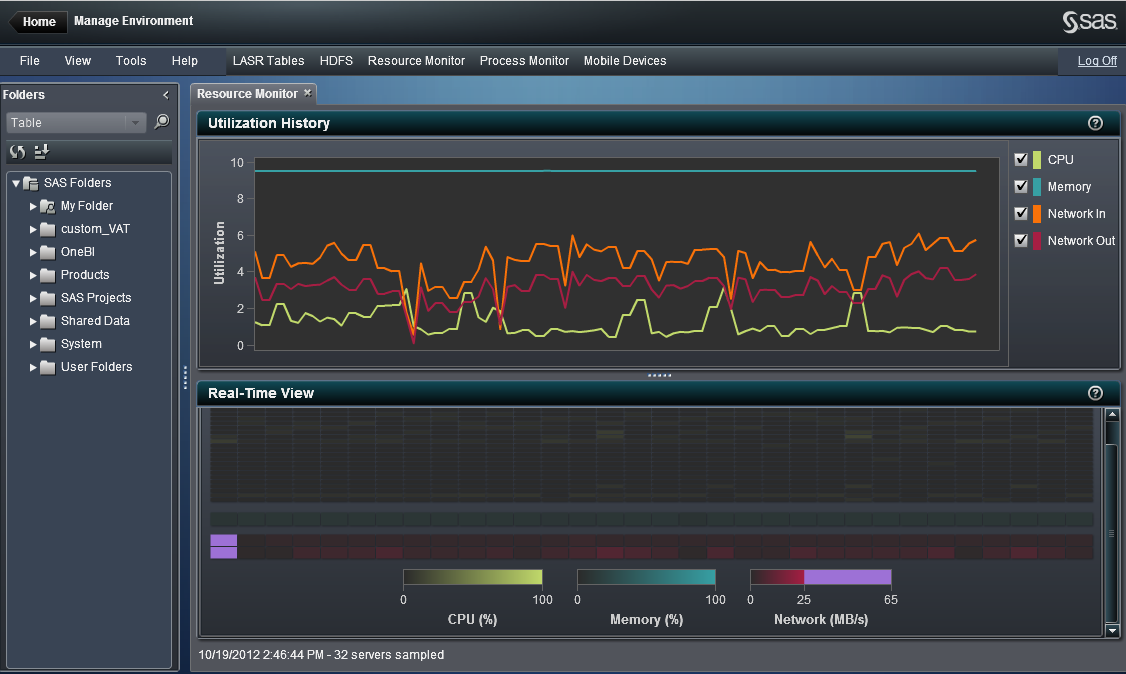
Utilization History
Information about the resource utilization is available
in the Resource Monitor tab. The resource
utilization is displayed in two graphs, the Utilization
History and the Real-Time View.
The graphs are updated according to a sampling rate. The sampling
rate is set in the application preferences.
The CPU and memory utilization
are plotted as a percentage of 100% capacity, though the graph scales
automatically. Under periods of high demand, the upper bound can reach
100%. Under periods of low demand, the upper bound can drop below
10%.
The network I/O utilization
is shown as one line plot for input and one line plot for output.
The plot shows the transfer rate in units of megabytes per second.
To view the resource
utilization for one sampling period, place your pointer over a line.
You can also click on a line to select the same sampling period for
all the resource line plots that are shown. This way, you can place
your pointer over each of the selected sampling periods to view the
utilization for each resource in the same sampling period.
Resource Monitor
Copyright © SAS Institute Inc. All rights reserved.