Statistical Graphics Using ODS
Overriding How Groups Are Distinguished
In the statistical graphics (SG) procedures, you can override the style attributes and modify how groups are distinguished by using the STYLEATTRS statement:
ods graphics on / attrpriority=none;
proc sgplot data=sashelp.iris;
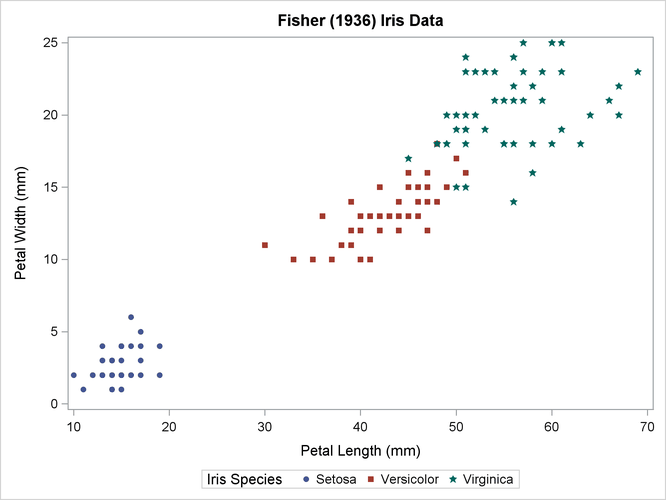
title 'Fisher (1936) Iris Data';
styleattrs datasymbols=(circlefilled squarefilled starfilled)
datacontrastcolors=(red green blue);
scatter x=petallength y=petalwidth / group=species markerattrs=(size=5px);
run;
ods graphics / reset;
The results are displayed in Figure 21.20.
Figure 21.20: Iris Data
The STYLEATTRS statement options are as follows:
In the SG procedures, you can override the style attributes and modify how groups are distinguished by using attribute maps:
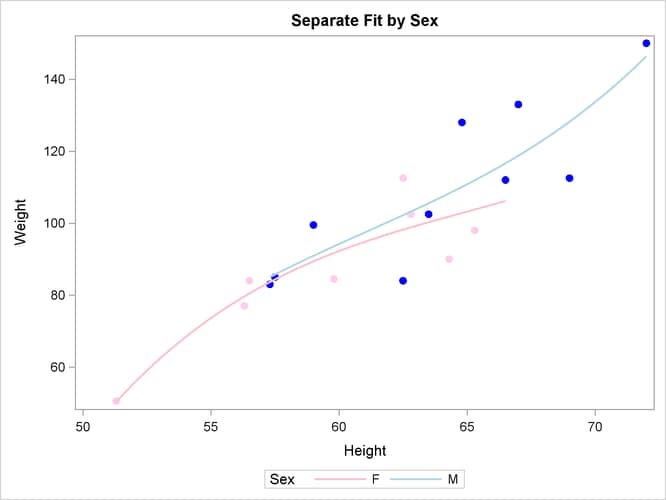
data myattrmap;
   retain ID 'Attr1' MarkerSymbol 'CircleFilled';
   input Value $ LineColor $ 3-11 MarkerColor $ 13-20;
   datalines;
F pink      cxFFCCEE
M lightblue blue
;

proc sgplot data=sashelp.class dattrmap=myattrmap;
   title 'Separate Fit by Sex';
   reg y=weight x=height / group=sex degree=3 attrid=Attr1;
run;
The results are displayed in Figure 21.21.
Figure 21.21: Color Changes with an Attribute Map
You can set the following variables and values in the PROC SGPLOT DATTRMAP=SAS-data-set option:
FillColor-
color or style attribute
FillStyle-
style element
ID-
text string that contains the attribute map ID
LineColor-
color or style attribute
LinePattern-
line pattern or style attribute
LineStyle-
style element
MarkerColor-
color or style attribute
MarkerStyle-
style element
MarkerSymbol-
symbol name or style attribute
Value-
text string that contains the group