Customizing the Kaplan-Meier Survival Plot
Kaplan-Meier Plot with Event Table and Other Customizations
This example combines a number of features from previous examples. The order of the strata levels in the tables is ALL, AML–Low Risk, and AML–High Risk (see the section Reordering the Groups). The title is set to 'Kaplan-Meier Plot' (see the section Changing the Plot Title). The second title line is suppressed (see the section Suppressing the Second Title and Adding a Footnote). The graph height is set to 500 pixels (see the section Suppressing the Legend). The legend and the inset box that contains the legend for censored values are both suppressed (see the sections Suppressing the Legend and Adding a Small Inset Table with Event Information). The event table is displayed outside the plot (see the section Adding an External Table with Event Information) and the at-risk table is displayed inside the plot (see the section Displaying the Patients-at-Risk Table inside the Plot).
proc format;
   invalue bmtnum 'ALL' = 1  'AML-Low Risk' = 2  'AML-High Risk' = 3;
   value   bmtfmt 1 = 'ALL'  2 = 'AML-Low Risk'  3 = 'AML-High Risk';
run;

data BMT(drop=g);
   set sashelp.BMT(rename=(group=g));
   Group = input(g, bmtnum.);
run;

%ProvideSurvivalMacros

%let TitleText2 = "Kaplan-Meier Plot";
%let nTitles    = 1;
%let GraphOpts  = DesignHeight=500px;
%let LegendOpts = ;
%let InsetOpts  = ;

%SurvivalSummaryTable

%CompileSurvivalTemplates

proc lifetest data=BMT plots=survival(cb=hw atrisk(maxlen=13));
   time T * Status(0);
   strata Group / order=internal;
   format group bmtfmt.;
run;
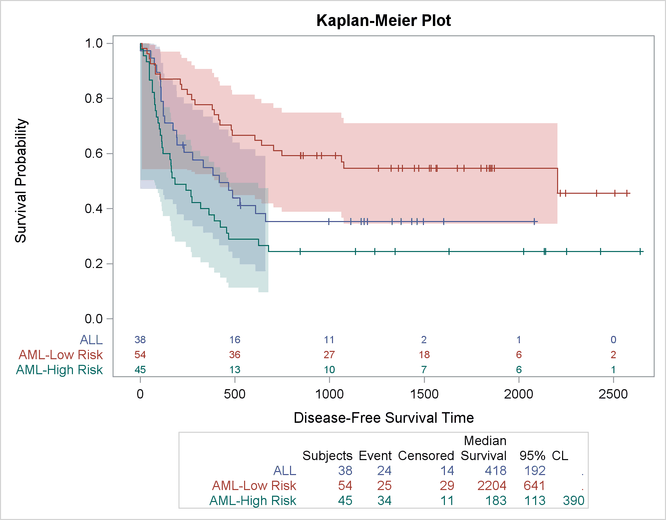
The results are displayed in Figure 23.32.
Figure 23.32: Kaplan-Meier Plot with Extensive Customizations