Customizing the Kaplan-Meier Survival Plot
Failure Plots
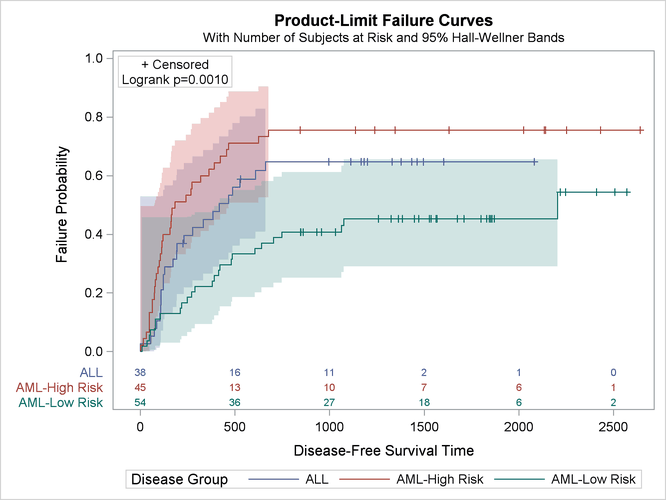
All the discussion up to this point has been about survival plots. You can instead plot failure probabilities by using the PLOTS=SURVIVAL(FAILURE) option as follows:
proc lifetest data=sashelp.BMT
     plots=survival(cb=hw failure test atrisk(maxlen=13));
   time T * Status(0);
   strata Group;
run;
The results are displayed in Figure 23.16.
Figure 23.16: Failure Plot