Customizing the Kaplan-Meier Survival Plot
Modifying At-Risk Table Times
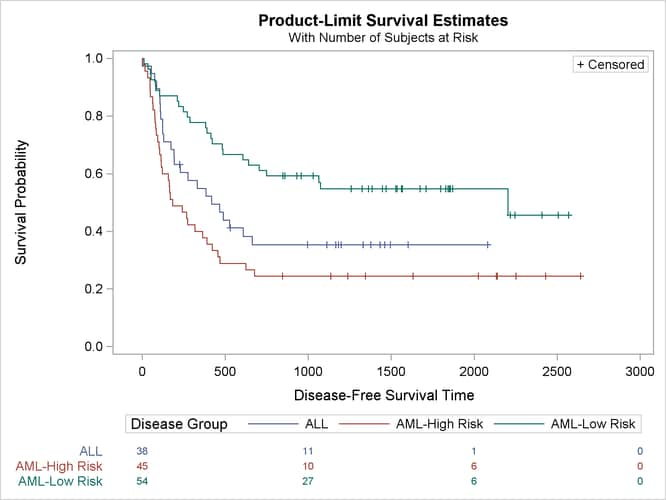
The following step explicitly controls the time values at which the at-risk values are displayed by using the PLOTS=SURVIVAL(ATRISK=0 TO 3000 BY 1000) option:
proc lifetest data=sashelp.BMT
              plots=survival(atrisk(maxlen=13 outside)=0 to 3000 by 1000);
   time T * Status(0);
   strata Group;
run;
The results are displayed in Figure 23.10.
Figure 23.10: Specifying At-Risk Values
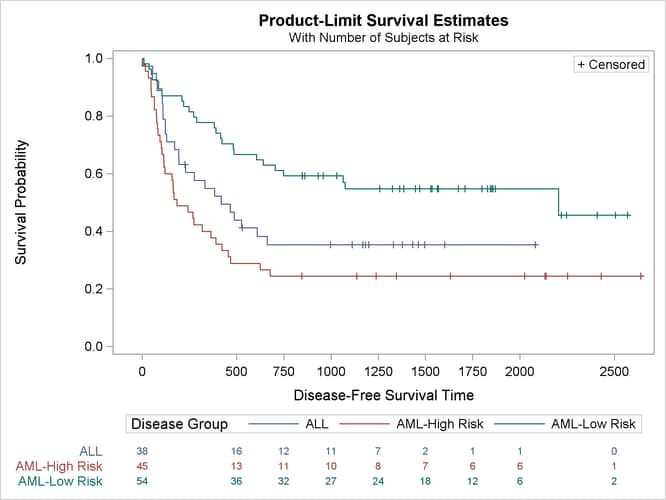
You can specify at-risk values that do not correspond to the original time axis tick marks. You can use the PLOTS=SURVIVAL(ATRISK(ATRISKTICK)) option to add tick marks that correspond to the specified at-risk values:
proc lifetest data=sashelp.BMT plots=survival(atrisk
   (atrisktick maxlen=13 outside)=0 500 750 1000 1250 1500 1750 2000 2500);
   time T * Status(0);
   strata Group;
run;
The results are displayed in Figure 23.11.
Figure 23.11: Controlling At-Risk Tick Marks
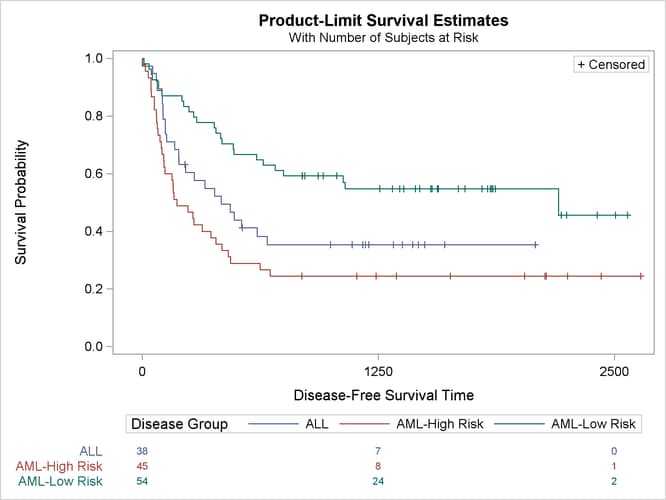
You can display tick values only at those times that are given in the ATRISK= list:
proc lifetest data=sashelp.BMT plots=survival(atrisk
   (atrisktickonly maxlen=13 outside)=0 1250 2500);
   time T * Status(0);
   strata Group;
run;
The results are displayed in Figure 23.12.
Figure 23.12: Controlling At-Risk Tick Marks