Introduction to Power and Sample Size Analysis
Narratives and Graphical User Interface (Power and Sample Size Application)
The Power and Sample Size application produces narratives for the results. Narratives are descriptions of the input parameters and a statement about the computed power or sample size.
For example, the Power and Sample Size application creates the following narrative for the scenario corresponding to the first row in Figure 18.1:
"For a two-sample pooled t test of a normal mean difference with a two-sided significance level of 0.05, assuming a common standard deviation of 12, a total sample size of 100 assuming a balanced design has a power of 0.541 to detect a mean difference of 5."
The Power and Sample Size application also provides multiple input parameter options, stores the results in a project format, displays power curves, and shows the SAS log and SAS code. You can access each project to review the results or to edit your input parameters and produce another analysis.
Where appropriate, several alternate ways of entering values for certain parameters are offered. For example, in the two-sample t test analysis, sample sizes can be entered in any of several parameterizations:
-
total sample size in a balanced design
-
sample size per group in a balanced design
-
total sample size and group allocation weights
-
groupwise sample sizes
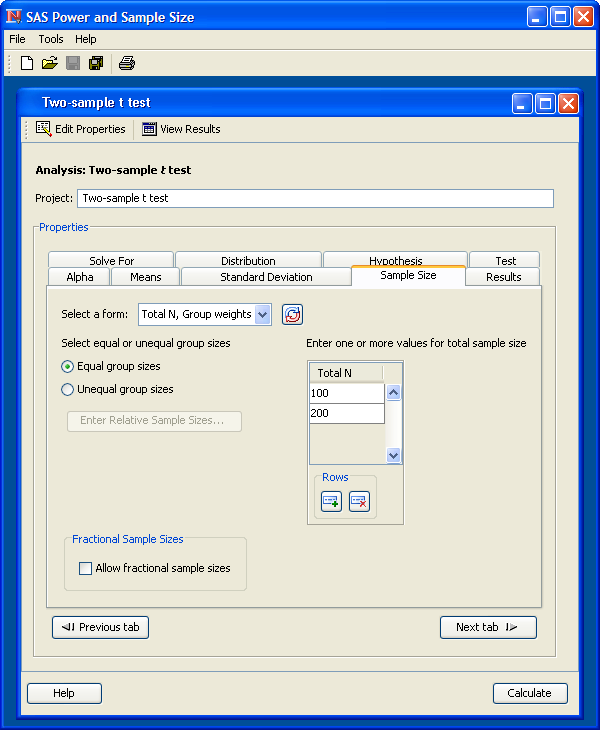
See Figure 18.5 for an illustration of the application, showing the sample size input page for a two-sample t test.
Figure 18.5: Power and Sample Size Application