The Power and Sample Size Application
Setting Preferences
In the Preferences window you can set default values for options that are used by all analyses.
To access the Preferences window, select → on the menu bar. Figure 90.23 shows the Preferences window.
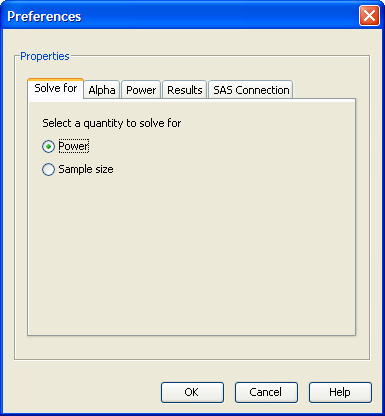
Figure 90.23: Preferences Window
Preference values are used as the defaults for each newly opened project (that is, those that are opened from the New window). For a specific project, each of these default values can be overridden on the Edit Properties page.
Changes in preferences do not change the state of an existing analysis (that is, one that is accessed from the Open window).
Selecting the Quantity to Solve For
Click the Solve For tab to select or as the default value to be solved for; see Figure 90.23. For confidence interval analyses, selecting is equivalent to selecting .
For analyses that offer both and , the option on this page corresponds to total sample size.
Setting Alphas
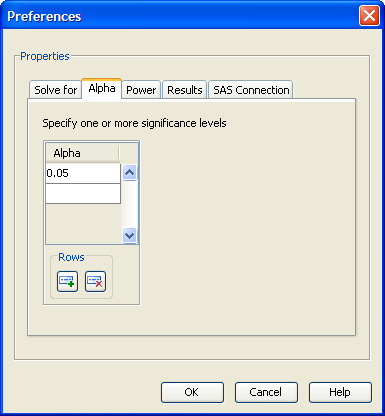
Click the Alpha tab to enter one or more values for alpha. Alpha is the significance level (false positive probability). For confidence interval analyses, alpha values are transformed into confidence levels by (1 – alpha). For example, an alpha of 0.05 would represent a confidence level of 0.95.
To set default values of alpha, enter one or more values in the Alpha data entry table. See Figure 90.24. It is not necessary to have any default values for alpha. Add more rows to the table as needed using the
 button at the bottom of the table.
Figure 90.24: Alpha Preference Tab
Setting Powers
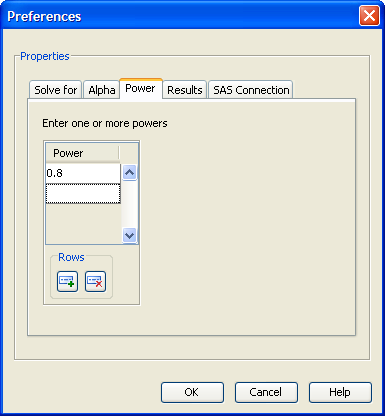
Click the Power tab to enter one or more values for power. It is not necessary to have any default values for power. For confidence interval analyses, power values are treated as prob(width) values.
To set default values of power, enter one or more values in the Power data entry table; see Figure 90.25.
Figure 90.25: Power Preference Tab
Setting Results Options
Click the Results tab to make default selections for the summary table and the power by sample size graph options; see Figure 90.26.
Figure 90.26: Results Options Preferences Tab
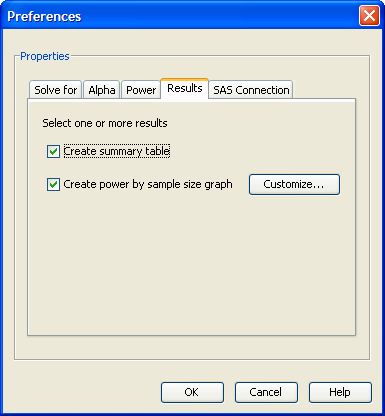
The summary table consists of the input parameter values and the calculated quantity (power or sample size). Select the check box to create the table by default.
To request that an analysis create a power by sample size graph by default, select the check box.