Customizing the Kaplan-Meier Survival Plot
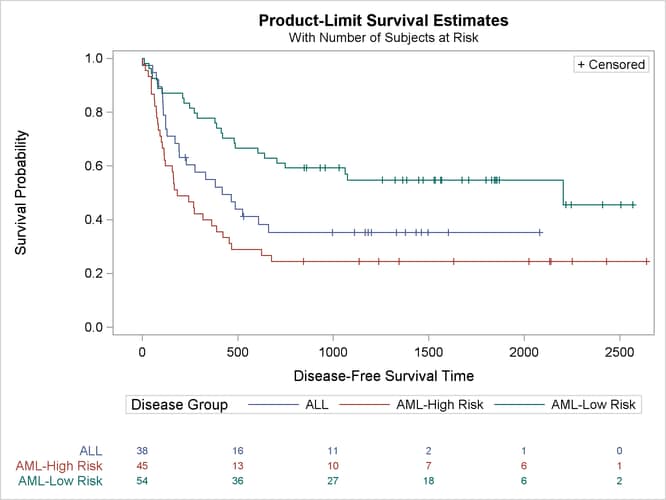
You can use the PLOTS=SURVIVAL(OUTSIDE) option to display the at-risk table outside the body of the plot. The option OUTSIDE(0.15) reserves 15% of the vertical graph window for the at-risk table. This example illustrates that the PLOTS= option has options nested within options and options nested within those nested options. The following step produces the plot in Figure 23.9:
proc lifetest data=sashelp.BMT
              plots=survival(atrisk(maxlen=13 outside(0.15)));
   time T * Status(0);
   strata Group;
run;