You can add the project and date to the bottom of all graphs produced with PROC REG by putting a PROC TEMPLATE statement in front of the template source code, and adding an MVAR and ENTRYFOOTNOTE statement after every BEGINGRAPH statement, as in the following example:
proc template;
   define statgraph Stat.Reg.Graphics.DiagnosticsPanel;
      notes "Diagnostics Panel";
      dynamic . . .;
      BeginGraph / designheight=defaultDesignWidth;

         mvar date;
         entryfootnote halign=left textattrs=GraphValueText date;

         entrytitle halign=left textattrs=GRAPHVALUETEXT _MODELLABEL
            halign=center textattrs=GRAPHTITLETEXT "Fit Diagnostics"
            " for " _DEPNAME;
         . . .
The MVAR statement enables you to dynamically customize the template and graph at procedure run time, just as the DYNAMIC statement enables the procedure to dynamically customize the template and graph. With the MVAR statement, you can modify the template once and reuse that modification as the macro changes over time: Alternatively, you can modify the templates as follows:
entryfootnote halign=left textattrs=GRAPHVALUETEXT "&date";
However, you would then have to resubmit your templates every time the macro variable changed. The substitution for the macro
variable date occurs at different times in the two preceding cases. In the former case, ODS looks for the value of the macro variable date at the time the template is used, and then the current date variable is used to set the text in the ENTRYFOOTNOTE statement, every time the template is used. In the latter case, SAS
substitutes the value of the macro variable once, at the time that the PROC TEMPLATE step is executed.
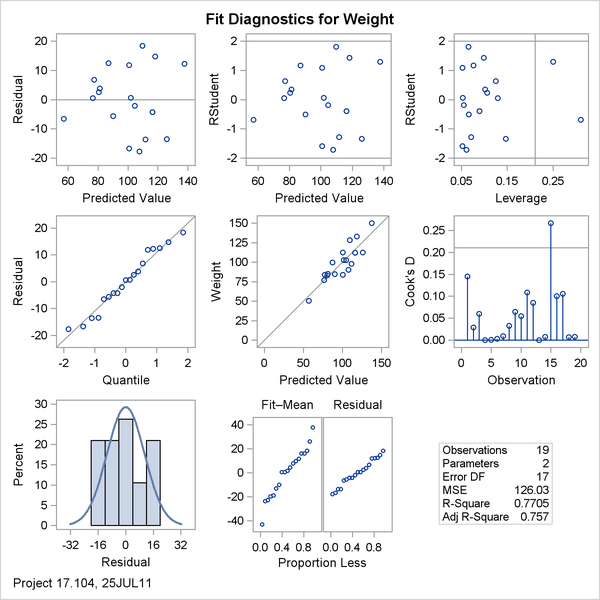
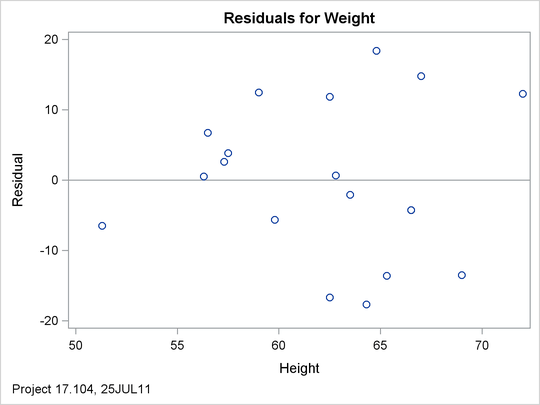
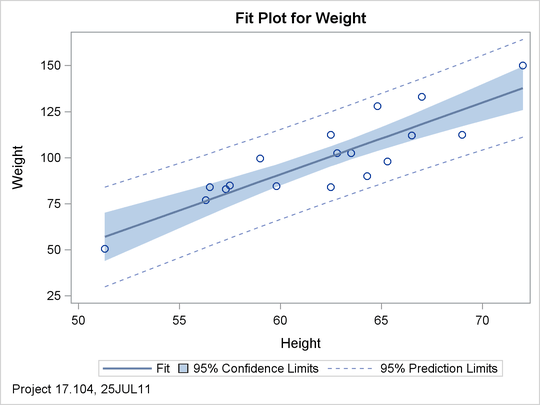
The following steps use the Class data set and produce Output 22.5.2:
ods graphics on;

proc reg data=sashelp.class plots=fit(stats=none);
   model weight = height;
run; quit;
You can restore all of the default templates for PROC REG by running the following step:
proc template;
   delete stat.reg / store=sasuser.templat;
run;
Alternatively, you can specify delete stat to restore all SAS/STAT templates to their default definitions.
You can add text to the top or the bottom of a graph by using the ENTRYTITLE or the ENTRYFOOTNOTE statement, respectively. With both statements, you can put the text in the HALIGN=RIGHT, HALIGN=LEFT, or HALIGN=CENTER positions. You can add text to titles even if they already have a centered title. For example, the ENTRYTITLE statement in the diagnostic panel has text on the left (which is conditionally displayed) and a centered title:
entrytitle halign=left textattrs=GraphValueText _MODELLABEL
   halign=center textattrs=GraphTitleText "Fit Diagnostics"
   " for " _DEPNAME;
The current title can be followed by HALIGN=RIGHT and more text.