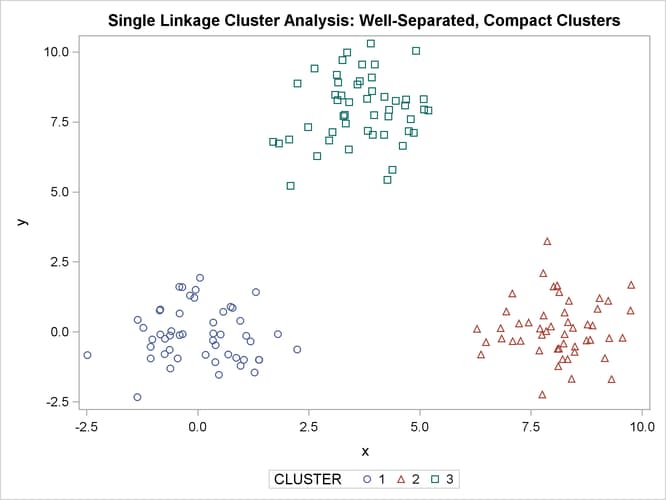
If the population clusters are sufficiently well separated, almost any clustering method performs well, as demonstrated in the following example, which uses single linkage. In this and subsequent examples, the output from the clustering procedures is not shown, but cluster membership is displayed in scatter plots. The SAS autocall macro MODSTYLE is specified to change the default marker symbols for the plot. For more information about autocall libraries, see SAS Macro Language: Reference. The following SAS statements produce Figure 11.1:
data compact;
   keep x y;
   n=50; scale=1;
   mx=0; my=0; link generate;
   mx=8; my=0; link generate;
   mx=4; my=8; link generate;
   stop;
generate:
   do i=1 to n;
      x=rannor(1)*scale+mx;
      y=rannor(1)*scale+my;
      output;
   end;
   return;
run;
proc cluster data=compact outtree=tree method=single noprint;
run;

proc tree noprint out=out n=3;
   copy x y;
run;

%modstyle(name=ClusterStyle,parent=Statistical,type=CLM,
markers=Circle Triangle Square circlefilled);
ods listing style=ClusterStyle;

proc sgplot;
   scatter y=y x=x / group=cluster;
   title 'Single Linkage Cluster Analysis: '
         'Well-Separated, Compact Clusters';
run;