You can easily modify many other features of this template. For example, you can change the locations of the inset table and the legend, which are controlled by the following statements:
%let gridopts = autoalign=(TOPRIGHT BOTTOMLEFT TOP BOTTOM)
                border=true BackgroundColor=GraphWalls:Color Opaque=true;
layout gridded / rows=2 &gridopts;

DiscreteLegend "Survival" / title=GROUPNAME location=outside;
The LAYOUT GRIDDED statement produces the two-row inset table displayed in the top right corner. The AUTOALIGN= option provides the preferred locations inside the plot for this table, ordered from most preferred to least preferred. You can add new locations or rearrange the existing locations. The DISCRETELEGEND statement places the legend outside of the plot. You can move it inside and print only one legend entry across each row instead of three. This has the effect of changing the orientation of the legend from a row to a column. The modified statements are as follows:
%let gridopts = autoalign=(BottomRight TOPRIGHT BOTTOMLEFT TOP BOTTOM)
                border=true BackgroundColor=GraphWalls:Color Opaque=true;
layout gridded / rows=2 &gridopts;

DiscreteLegend "Survival" / title=GROUPNAME across=1 location=inside
   autoalign=(TopRight BottomLeft Top Bottom);
These changes are incorporated into the template as follows:
%SurvivalTemplateRestore

%let TitleText0 = "Kaplan-Meier Plot";
%let TitleText1 = &titletext0 " for " STRATUMID;
%let TitleText2 = &titletext0;

%let gridopts = autoalign=(BottomRight TOPRIGHT BOTTOMLEFT TOP BOTTOM)
                border=true BackgroundColor=GraphWalls:Color Opaque=true;

%macro multiplestrata;
  if (PLOTHW)
      bandplot LimitUpper=HW_UCL LimitLower=HW_LCL x=TIME / &bandopts
               datatransparency=Transparency;
   endif;
   if (PLOTEP)
      bandplot LimitUpper=EP_UCL LimitLower=EP_LCL x=TIME / &bandopts
               datatransparency=Transparency;
   endif;
   if (PLOTCL)
      if (PLOTBAND)
         bandplot LimitUpper=SDF_UCL LimitLower=SDF_LCL x=TIME / &bandopts
                  display=(outline);
      else
         bandplot LimitUpper=SDF_UCL LimitLower=SDF_LCL x=TIME / &bandopts
                  datatransparency=Transparency;
      endif;
   endif;

   stepplot y=SURVIVAL x=TIME / &groups name="Survival" &tips;

   if (PLOTCENSORED)
      scatterplot y=CENSORED x=TIME / &groups &censored &tipl;
   endif;

   if (PLOTATRISK=1)
      innermargin / align=bottom;
         blockplot x=TATRISK block=ATRISK / class=CLASSATRISK
            display=(label values) &blockopts;
      endinnermargin;
   endif;

   DiscreteLegend "Survival" / title=GROUPNAME across=1 location=inside
      autoalign=(TopRight BottomLeft Top Bottom);

   if (PLOTCENSORED)
      if (PLOTTEST)
         layout gridded / rows=2 &gridopts;
            entry &censorstr;
            %entry_p
         endlayout;
      else
         layout gridded / rows=1 &gridopts;
            entry &censorstr;
         endlayout;
      endif;
   else
      if (PLOTTEST)
         layout gridded / rows=1 &gridopts;
            %entry_p
         endlayout;
      endif;
   endif;
%mend;

%SurvivalTemplate
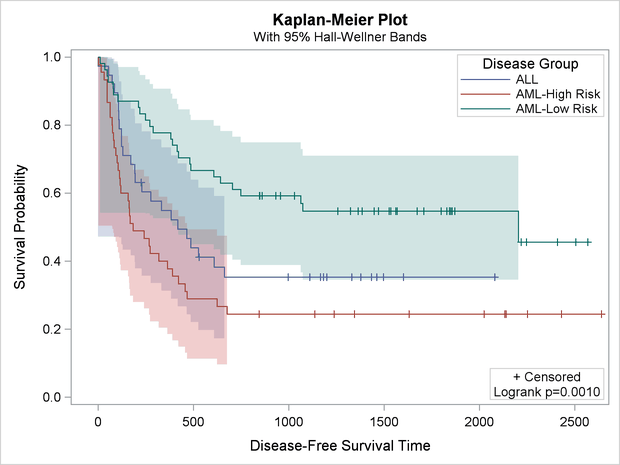
The new template along with the following statements produce Output 22.3.4:
proc lifetest data=sashelp.BMT plots=survival(cb=hw test);
   time T * Status(0);
   strata Group;
run;
You can restore the default macros, macro variables, and template by running the following steps:
%SurvivalTemplateRestore

proc template;
   delete Stat.Lifetest.Graphics.ProductLimitSurvival / store=sasuser.templat;
run;