| Introduction to Power and Sample Size Analysis |
| Computing Power and Sample Size |
For some statistical models and tests, power analysis calculations are exact—that is, they are based on a mathematically accurate formula that expresses power in terms of the other components. Such formulas typically involve either enumeration or noncentral versions of the distribution of the test statistic.
When a power computation is based on a noncentral  ,
,  , or chi-square distribution, the noncentrality parameter generally has the same form as the test statistic, with the conjectured population parameters in place of their corresponding estimators.
For example, the test statistic for a two-sample t test is computed as follows:
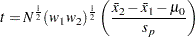 |
where  is the total sample size,
  and
and  are the group allocation weights,
  and
and  are the sample means,
  is the null mean difference, and
  is the pooled standard deviation. Under the null hypothesis, the statistic
  is distributed as
  . In general, has a noncentral distribution
  where
where
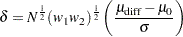 |
and  and
and  are the (unknown) true mean difference and common group standard deviation, respectively. Note that the square-root noncentrality
  is exactly the same as the statistic except that the estimators of mean difference and standard deviation are replaced by their correponding true population values.
The power for the two-sided two-sample t test with significance level  is computed as
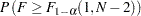 |
where is distributed as and  is the
  % quantile of the central distribution with
  and
and  degrees of freedom. See the section Customized Power Formulas (DATA Step) for an example of the implementation of this formula in the DATA step.
In the absence of exact mathematical results, approximate formulas can sometimes be used. When neither exact power computations nor reasonable approximations are possible, simulation provides an increasingly viable alternative. You specify values for model parameters and use them to randomly generate a large number of hypothetical data sets. Applying the statistical test to each data set, you estimate power with the percentage of times the null hypothesis is rejected. While the simulation approach is computationally intensive, faster computing makes this less of an issue. A simulation-based power analysis is always a valid option, and, with a large number of data set replications, it can often be more accurate than approximations. See the section Empirical Power Simulation (DATA Step, SAS/STAT Software) for an example of an empirical power simulation.
Sample size is usually computed by iterative numerical methods because it often cannot be expressed in closed form as a function of the other parameters. Sample size tends to appear in both a noncentrality parameter and a degrees of freedom term for the critical value.
Copyright © SAS Institute, Inc. All Rights Reserved.