| The FREQ Procedure |
Cochran-Mantel-Haenszel Statistics
The CMH option in the TABLES statement gives a stratified statistical analysis of the relationship between the row and column variables after controlling for the strata variables in a multiway table. For example, for the table request A*B*C*D, the CMH option provides an analysis of the relationship between C and D, after controlling for A and B. The stratified analysis provides a way to adjust for the possible confounding effects of A and B without being forced to estimate parameters for them.
The CMH analysis produces Cochran-Mantel-Haenszel statistics, which include the correlation statistic, the ANOVA (row mean scores) statistic, and the general association statistic. For  tables, the CMH option also provides Mantel-Haenszel and logit estimates of the common odds ratio and the common relative risks, as well as the Breslow-Day test for homogeneity of the odds ratios.
Exact statistics are also available for stratified tables. If you specify the EQOR option in the EXACT statement, PROC FREQ provides Zelen’s exact test for equal odds ratios. If you specify the COMOR option in the EXACT statement, PROC FREQ provides exact confidence limits for the common odds ratio and an exact test that the common odds ratio equals one.
Let the number of strata be denoted by  , indexing the strata by
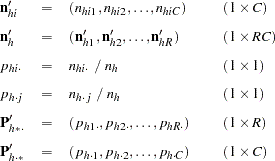
  . Each stratum contains a contingency table with X representing the row variable and Y representing the column variable. For table
  , denote the cell frequency in row
  and column
  by
by  , with corresponding row and column marginal totals denoted by
  and
and  , and the overall stratum total by
  .
.
Because the formulas for the Cochran-Mantel-Haenszel statistics are more easily defined in terms of matrices, the following notation is used. Vectors are presumed to be column vectors unless they are transposed  .
.
 |
Assume that the strata are independent and that the marginal totals of each stratum are fixed. The null hypothesis,  , is that there is no association between X and Y in any of the strata. The corresponding model is the multiple hypergeometric; this implies that, under , the expected value and covariance matrix of the frequencies are, respectively,
 |
 |
where
 |
and where  denotes Kronecker product multiplication and
  is a diagonal matrix with the elements of
  on the main diagonal.
The generalized CMH statistic (Landis, Heyman, and Koch 1978) is defined as
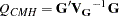 |
where
 |
 |
 |
|||
 |
|
 |
and where
 |
is a matrix of fixed constants based on column scores  and row scores
  . When the null hypothesis is true, the CMH statistic has an asymptotic chi-square distribution with degrees of freedom equal to the rank of
  . If
. If  is found to be singular, PROC FREQ prints a message and sets the value of the CMH statistic to missing.
PROC FREQ computes three CMH statistics by using this formula for the generalized CMH statistic, with different row and column score definitions for each statistic. The CMH statistics that PROC FREQ computes are the correlation statistic, the ANOVA (row mean scores) statistic, and the general association statistic. These statistics test the null hypothesis of no association against different alternative hypotheses. The following sections describe the computation of these CMH statistics.
Caution:The CMH statistics have low power for detecting an association in which the patterns of association for some of the strata are in the opposite direction of the patterns displayed by other strata. Thus, a nonsignificant CMH statistic suggests either that there is no association or that no pattern of association has enough strength or consistency to dominate any other pattern.
Correlation Statistic
The correlation statistic, popularized by Mantel and Haenszel (1959) and Mantel (1963), has one degree of freedom and is known as the Mantel-Haenszel statistic.
The alternative hypothesis for the correlation statistic is that there is a linear association between X and Y in at least one stratum. If either X or Y does not lie on an ordinal (or interval) scale, then this statistic is not meaningful.
To compute the correlation statistic, PROC FREQ uses the formula for the generalized CMH statistic with the row and column scores determined by the SCORES= option in the TABLES statement. See the section Scores for more information about the available score types. The matrix of row scores has dimension  , and the matrix of column scores has dimension
  .
.
When there is only one stratum, this CMH statistic reduces to  , where
  is the Pearson correlation coefficient between
  and
and  . When nonparametric (RANK or RIDIT) scores are specified, the statistic reduces to
  , where
  is the Spearman rank correlation coefficient between X and Y. When there is more than one stratum, this CMH statistic becomes a stratum-adjusted correlation statistic.
ANOVA (Row Mean Scores) Statistic
The ANOVA statistic can be used only when the column variable Y lies on an ordinal (or interval) scale so that the mean score of Y is meaningful. For the ANOVA statistic, the mean score is computed for each row of the table, and the alternative hypothesis is that, for at least one stratum, the mean scores of the  rows are unequal. In other words, the statistic is sensitive to location differences among the distributions of Y.
The matrix of column scores has dimension , and the column scores are determined by the SCORES= option.
The matrix of row scores has dimension  and is created internally by PROC FREQ as
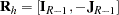 |
where  is an identity matrix of rank
  and
and  is an
is an  vector of ones. This matrix has the effect of forming independent contrasts of the mean scores.
When there is only one stratum, this CMH statistic is essentially an analysis of variance (ANOVA) statistic in the sense that it is a function of the variance ratio  statistic that would be obtained from a one-way ANOVA on the dependent variable Y. If nonparametric scores are specified in this case, then the ANOVA statistic is a Kruskal-Wallis test.
If there is more than one stratum, then this CMH statistic corresponds to a stratum-adjusted ANOVA or Kruskal-Wallis test. In the special case where there is one subject per row and one subject per column in the contingency table of each stratum, this CMH statistic is identical to Friedman’s chi-square. See Example 35.9 for an illustration.
General Association Statistic
The alternative hypothesis for the general association statistic is that, for at least one stratum, there is some kind of association between X and Y. This statistic is always interpretable because it does not require an ordinal scale for either X or Y.
For the general association statistic, the matrix is the same as the one used for the ANOVA statistic. The matrix is defined similarly as
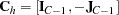 |
PROC FREQ generates both score matrices internally. When there is only one stratum, then the general association CMH statistic reduces to  , where
  is the Pearson chi-square statistic. When there is more than one stratum, then the CMH statistic becomes a stratum-adjusted Pearson chi-square statistic. Note that a similar adjustment can be made by summing the Pearson chi-squares across the strata. However, the latter statistic requires a large sample size in each stratum to support the resulting chi-square distribution with
  degrees of freedom. The CMH statistic requires only a large overall sample size because it has only
  degrees of freedom.
See Cochran (1954); Mantel and Haenszel (1959); Mantel (1963); Birch (1965); and Landis, Heyman, and Koch (1978).
Adjusted Odds Ratio and Relative Risk Estimates
The CMH option provides adjusted odds ratio and relative risk estimates for stratified tables. For each of these measures, PROC FREQ computes a Mantel-Haenszel estimate and a logit estimate. These estimates apply to n-way table requests in the TABLES statement, when the row and column variables both have two levels.
For example, for the table request A*B*C*D, if the row and column variables C and D both have two levels, PROC FREQ provides odds ratio and relative risk estimates, adjusting for the confounding variables A and B.
The choice of an appropriate measure depends on the study design. For case-control (retrospective) studies, the odds ratio is appropriate. For cohort (prospective) or cross-sectional studies, the relative risk is appropriate. See the section Odds Ratio and Relative Risks for 2 x 2 Tables for more information on these measures.
Throughout this section,  denotes the
  th percentile of the standard normal distribution.
Odds Ratio, Case-Control Studies
PROC FREQ provides Mantel-Haenszel and logit estimates for the common odds ratio for stratified tables.
The Mantel-Haenszel estimate of the common odds ratio is computed as
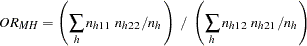 |
It is always computed unless the denominator is zero. See Mantel and Haenszel (1959) and Agresti (2002) for details.
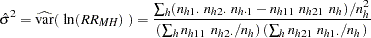
To compute confidence limits for the common odds ratio, PROC FREQ uses the Greenland and Robins (1985) variance estimate for  . The
. The  confidence limits for the common odds ratio are
 |
where
 |
|
 |
|||
 |
|
 |
|||
|
|
 |
|||
|
|
 |
Note that the Mantel-Haenszel odds ratio estimator is less sensitive to small  than the logit estimator.
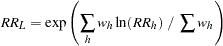
The adjusted logit estimate of the common odds ratio (Woolf 1955) is computed as
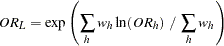 |
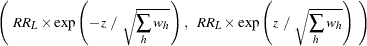
and the corresponding  % confidence limits are
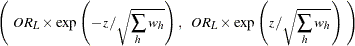 |
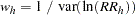
where  is the odds ratio for stratum
  , and
, and
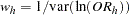 |
If any table cell frequency in a stratum is zero, PROC FREQ adds  to each cell of the stratum before computing and
  (Haldane 1955) for the logit estimate. The procedure prints a warning when this occurs.
Relative Risks, Cohort Studies
PROC FREQ provides Mantel-Haenszel and logit estimates of the common relative risks for stratified tables.
The Mantel-Haenszel estimate of the common relative risk for column 1 is computed as
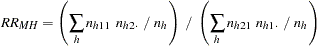 |
It is always computed unless the denominator is zero. See Mantel and Haenszel (1959) and Agresti (2002) for more information.
To compute confidence limits for the common relative risk, PROC FREQ uses the Greenland and Robins (1985) variance estimate for  . The confidence limits for the common relative risk are
 |
where
 |
The adjusted logit estimate of the common relative risk for column 1 is computed as
 |
and the corresponding % confidence limits are
 |
where  is the column 1 relative risk estimate for stratum and
 |
If  or
or  is zero, then PROC FREQ adds to each cell of the stratum before computing and for the logit estimate. The procedure prints a warning when this occurs. See Kleinbaum, Kupper, and Morgenstern (1982, Sections 17.4 and 17.5) for details.
Breslow-Day Test for Homogeneity of the Odds Ratios
When you specify the CMH option, PROC FREQ computes the Breslow-Day test for stratified tables. It tests the null hypothesis that the odds ratios for the  strata are equal. When the null hypothesis is true, the statistic has approximately a chi-square distribution with
  degrees of freedom. See Breslow and Day (1980) and Agresti (2007) for more information.
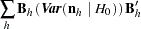
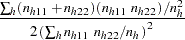
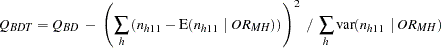
The Breslow-Day statistic is computed as
 |
where  and
and  denote expected value and variance, respectively. The summation does not include any table with a zero row or column. If
  equals zero or if it is undefined, then PROC FREQ does not compute the statistic and prints a warning message.
For the Breslow-Day test to be valid, the sample size should be relatively large in each stratum, and at least 80% of the expected cell counts should be greater than 5. Note that this is a stricter sample size requirement than the requirement for the Cochran-Mantel-Haenszel test for  tables, in that each stratum sample size (not just the overall sample size) must be relatively large. Even when the Breslow-Day test is valid, it might not be very powerful against certain alternatives, as discussed in Breslow and Day (1980).
If you specify the BDT option, PROC FREQ computes the Breslow-Day test with Tarone’s adjustment, which subtracts an adjustment factor from  to make the resulting statistic asymptotically chi-square. The Breslow-Day-Tarone statistic is computed as
 |
See Tarone (1985), Jones et al. (1989), and Breslow (1996) for more information.
Zelen’s Exact Test for Equal Odds Ratios
If you specify the EQOR option in the EXACT statement, PROC FREQ computes Zelen’s exact test for equal odds ratios for stratified tables. Zelen’s test is an exact counterpart to the Breslow-Day asymptotic test for equal odds ratios. The reference set for Zelen’s test includes all possible  tables with the same row, column, and stratum totals as the observed multiway table and with the same sum of cell
  frequencies as the observed table. The test statistic is the probability of the observed table conditional on the fixed margins, which is a product of hypergeometric probabilities.
The p-value for Zelen’s test is the sum of all table probabilities that are less than or equal to the observed table probability, where the sum is computed over all tables in the reference set determined by the fixed margins and the observed sum of cell frequencies. This test is similar to Fisher’s exact test for two-way tables. See Zelen (1971), Hirji (2006), and Agresti (1992) for more information. PROC FREQ computes Zelen’s exact test by using the polynomial multiplication algorithm of Hirji et al. (1996).
Exact Confidence Limits for the Common Odds Ratio
If you specify the COMOR option in the EXACT statement, PROC FREQ computes exact confidence limits for the common odds ratio for stratified tables. This computation assumes that the odds ratio is constant over all the tables. Exact confidence limits are constructed from the distribution of  , conditional on the marginal totals of the tables.
Because this is a discrete problem, the confidence coefficient for these exact confidence limits is not exactly ( ) but is at least (). Thus, these confidence limits are conservative. See Agresti (1992) for more information.
PROC FREQ computes exact confidence limits for the common odds ratio by using an algorithm based on Vollset, Hirji, and Elashoff (1991). See also Mehta, Patel, and Gray (1985).
Conditional on the marginal totals of table , let the random variable  denote the frequency of table cell . Given the row totals
  and
and  and column totals
  and
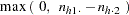
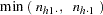
and  , the lower and upper bounds for
  are
are  and
and  ,
,
 |
 |
 |
|||
 |
|
 |
Let  denote the hypergeometric coefficient,
 |
and let  denote the common odds ratio. Then the conditional distribution of is
 |
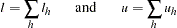
Summing over all the tables,  , and the lower and upper bounds of
  are
are  and
and  ,
,
 |
The conditional distribution of the sum is
 |
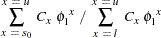
where
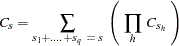 |
Let  denote the observed sum of cell (1,1) frequencies over the tables. The following two equations are solved iteratively for lower and upper confidence limits for the common odds ratio,
  and
and  :
:
 |
|
 |
|||
 |
|
|
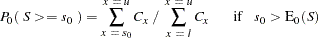
When the observed sum equals the lower bound , PROC FREQ sets the lower confidence limit to zero and determines the upper limit with level  . Similarly, when the observed sum equals the upper bound , PROC FREQ sets the upper confidence limit to infinity and determines the lower limit with level .
When you specify the COMOR option in the EXACT statement, PROC FREQ also computes the exact test that the common odds ratio equals one. Setting  , the conditional distribution of the sum under the null hypothesis becomes
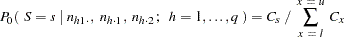 |
The point probability for this exact test is the probability of the observed sum under the null hypothesis, conditional on the marginals of the stratified  tables, and is denoted by
  . The expected value of under the null hypothesis is
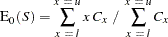 |
The one-sided exact p-value is computed from the conditional distribution as  or
or  , depending on whether the observed sum is greater or less than
  ,
,
 |
|
 |
|||
|
|
 |
PROC FREQ computes two-sided p-values for this test according to three different definitions. A two-sided p-value is computed as twice the one-sided p-value, setting the result equal to one if it exceeds one,
 |
Additionally, a two-sided p-value is computed as the sum of all probabilities less than or equal to the point probability of the observed sum , summing over all possible values of  ,
,  ,
,
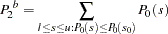 |
Also, a two-sided p-value is computed as the sum of the one-sided p-value and the corresponding area in the opposite tail of the distribution, equidistant from the expected value,
 |
Copyright © 2009 by SAS Institute Inc., Cary, NC, USA. All rights reserved.