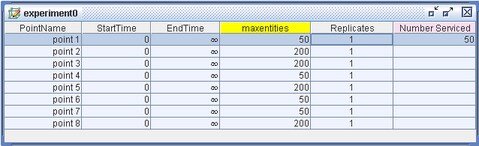
Figure 5.10 shows a sample Experiment window. This table is sometimes referred to as the design matrix for an experiment. All the information associated with an experiment is displayed in the design matrix. Each row in the matrix is called a design point, and it can contain values for a label, execution controls, factor settings, and responses measured during model execution. You can add or remove design points by using the pop-up menu available on the Experiment window background.
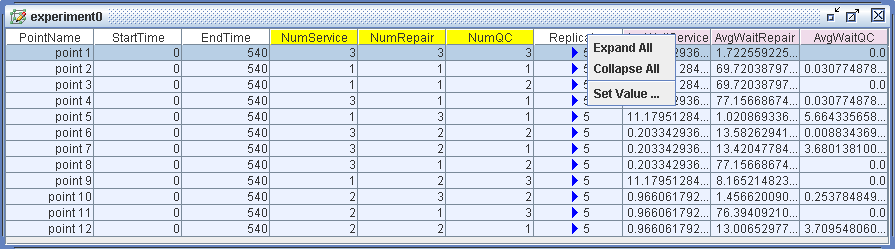
The design matrix is initially populated with four default columns labeled PointName, StartTime, EndTime, and Replicates. The PointName column assigns a label to the design point. Although a default value (pointN) is generated for this field when the design point is created, you can edit this field to be any text you choose. The StartTime and EndTime values control the execution start time and end time (on the simulation clock) for an individual simulation run. The simulation clock begins running at the value displayed in the StartTime field for the design point, and the simulation ends or stops when the simulation clock reaches the time entered in the EndTime field. (Note that time has no unit in Simulation Studio.) The final default column in the design matrix is labeled Replicates. The value contained in this field represents how many times you want to run this particular design point. You can edit the default values for StartTime, EndTime, and Replicates by selecting Properties from the Experiment window pop-up menu and modifying the values in the resulting properties dialog box. The default values set in the properties dialog box are applied to new design points that are subsequently added to the Experiment window. Changes to the default values for StartTime, EndTime, and Replicates are not applied to existing design points. The StartTime, EndTime, and Replicates columns each have a pop-up menu (available by right-clicking the column name) that has a menu item called Set Value. Figure 5.11 shows the pop-up menu for the Replicates column.
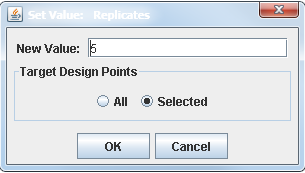
Selecting Set Value opens the Set Value: Replicates dialog box, which is shown in Figure 5.12. The New Value text box enables you to specify a value for the number of replications. The All and Selected options enable you to specify whether the new value should be applied to all design points or to just the selected ones.
The value that initially appears in the New Value field is the default replicates value, which is set in the Experiment window properties dialog box. The Set Value: EndTime
and Set Value: StartTime dialog boxes have similar functionality to the the Set Value: Replicates dialog box.
Each replication of a design point uses the same factor settings. However, different random substreams are used in each replication. Additional details about replicates are provided in Appendix C: Design of Experiments.
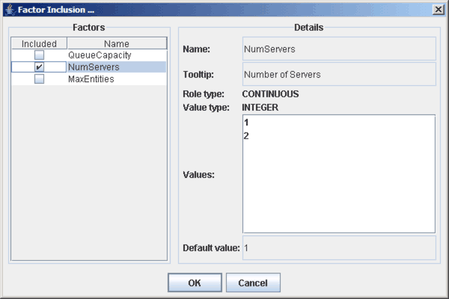
Only the default columns in the design matrix are necessary to actually run a simulation model. Figure 5.10 shows a design matrix with one additional factor, maxentities, and one response, Number Serviced. Any factors or responses defined on a project can be added to the design matrix by using the Factor Inclusion or Response Inclusion dialog boxes, respectively. You can open these dialog boxes via menu entries in the Experiment window pop-up menu. Figure 5.13 shows a sample Factor Inclusion dialog box. The names of all the factors defined on the project are listed in the Factors list along with an individual check box for each entry. In this example three factors have been defined on the project. When you select the factor name, the details associated with that factor are displayed on the right side of the dialog box. The check box adjacent to the factor name controls inclusion of the factor into the design matrix. In Figure 5.13 only the factor named NumServers is included in the experiment. The Response Inclusion dialog box works analogously to the Factor Inclusion dialog.
Color coding in the column header of the design matrix indicates which role that column plays in the experiment. The default columns have gray headers; any added factors are denoted by yellow background headers; and a pink background header is used for response columns.