The SHEWHART Procedure
Applying Tests with Varying Subgroup Sample Sizes
Note: See Requesting Tests for Special Causes in the SAS/QC Sample Library.
Nelson (1989, 1994) describes the use of standardization to apply the tests for special causes to data involving varying subgroup samples. This
approach applies the tests to the standardized subgroup statistics, setting the control limits at  and the zone boundaries at
  and
and  . For instance, for an
  chart with subgroup means
  and varying subgroup sample sizes
  , the tests are applied to the standardized values
  , where
  estimates the process mean, and s estimates the process standard deviation. You can request this method with the TESTNMETHOD= option,[43] as illustrated by the following statements:
ods graphics off;
title 'Analysis of Assembly Data';
symbol v=dot;
proc shewhart history=Assembly;
   xrchart Offset * Sample / mu0         = 20
                             sigma0      = 2.24
                             tests       = 1 to 4
                             testnmethod = standardize
                             testlabel   = space
                             vaxis       = 16 to 26 by 2
                             wtests      = 1
                             split       = '/';
   label OffsetX = 'Avg Offset in cm/Range';
run;
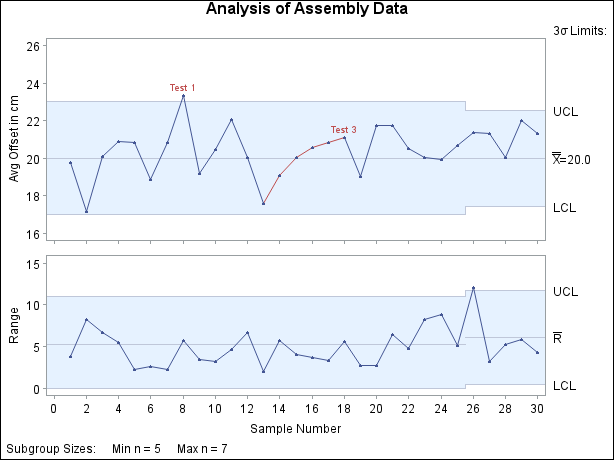
Here the tests are applied to  . The chart, shown in Figure 18.181, displays the results of the tests on a plot of the unstandardized means.
Figure 18.181: The TESTNMETHOD= Option for Varying Subgroup Sizes

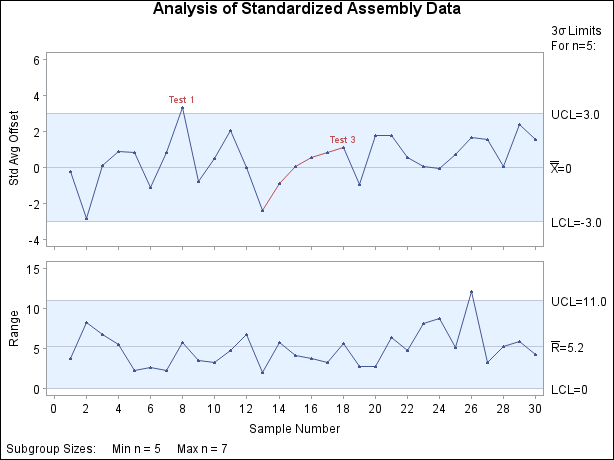
The following statements create an equivalent chart that plots the standardized means:
data Assembly;
   set Assembly;
   zx = ( OffsetX - 20 ) / ( 2.24 / sqrt( OffsetN ) );
run;
ods graphics off;
title 'Analysis of Standardized Assembly Data';
symbol v=dot;
proc shewhart
   history=Assembly (rename = (OffsetR=zr OffsetN=zn));
   xrchart z * Sample / mu0         = 0
                        sigma0      = 2.2361 /* sqrt 5 */
                        limitn      = 5
                        alln
                        tests       = 1 to 4
                        testlabel   = space
                        vaxis       = -4 to 6 by 2
                        wtests      = 1
                        split = '/';
   label zx = 'Std Avg Offset/Range';
run;
Here, the SIGMA0= value is the square root of the LIMITN= value. The chart is shown in Figure 18.182.
Figure 18.182: Tests with Standardized Means

Note: In situations where the standard deviation is estimated from the data and the subgroup sample sizes vary, you can use the SMETHOD= option to request various estimation methods, including the method of Burr (1969).
[43] If the TESTNMETHOD= option were omitted in this example, the tests would not be applied, and a warning message would be displayed in the SAS log.