The SHEWHART Procedure
When the variances across product types are not constant, various authors recommend standardizing the differences from nominal and displaying them on a common chart with
control limits at ![]() .
.
To illustrate this method, assume that the hypothesis of homogeneity is rejected for the differences in Old. Then you can use the product-specific estimates of ![]() in
in Baselim to standardize the differences from nominal in New and create the standardized chart as follows:
proc sort data=new;
   by Prodtype;
run;

data new;
   keep Sample Prodtype z Diff Diameter Nominal _stddev_;
   label Sample = 'Sample Number';
   format Diff 5.2 ;
   merge Baselim new(in = a);
      by Prodtype;
   if a;
   z = (Diameter - Nominal) / _stddev_ ;
run;

proc sort data=new;
   by Sample;
run;
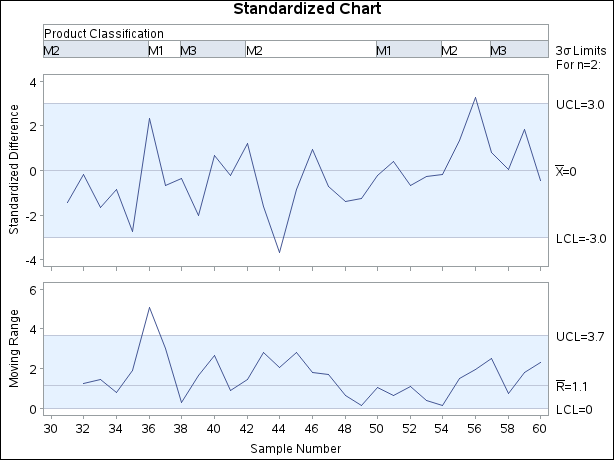
title 'Standardized Chart';
proc shewhart data=new;
   irchart z*Sample (Prodtype) /
      blocklabtype  = scaled
      mu0           = 0
      sigma0        = 1
      split         = '/';
   label Prodtype = 'Product Classification'
         z = 'Standardized Difference/Moving Range';
run;
Note that the options MU0= and SIGMA= specify that the control limits for the standardized differences from nominal are to
be based on the parameters ![]() and
and ![]() . The chart is displayed in Figure 17.214.
. The chart is displayed in Figure 17.214.