The NETDRAW Procedure
- Overview
- Getting Started
-
Syntax

-
DetailsNetwork Input Data SetVariables in the Network Data SetMissing ValuesLayout of the NetworkFormat of the DisplayPage FormatLayout Data SetControlling the LayoutTime-Scaled Network DiagramsZoned Network DiagramsOrganizational Charts or Tree DiagramsFull-Screen VersionGraphics VersionUsing the Annotate FacilityWeb-Enabled Network DiagramsMacro Variable _ORNETDRComputer Resource RequirementsODS Style Templates
-
ExamplesLine-Printer Network DiagramGraphics Version of PROC NETDRAWSpanning Multiple PagesThe COMPRESS and PCOMPRESS OptionsControlling the Display FormatNonstandard Precedence RelationshipsControlling the Arc-Routing AlgorithmPATTERN and SHOWSTATUS OptionsTime-Scaled Network DiagramFurther Time-Scale OptionsZoned Network DiagramSchematic DiagramsModifying Network LayoutSpecifying Node PositionsOrganizational Charts with PROC NETDRAWAnnotate Facility with PROC NETDRAWAOA Network Using the Annotate FacilityBranch and Bound TreesStatement and Option Cross-Reference Tables
- References
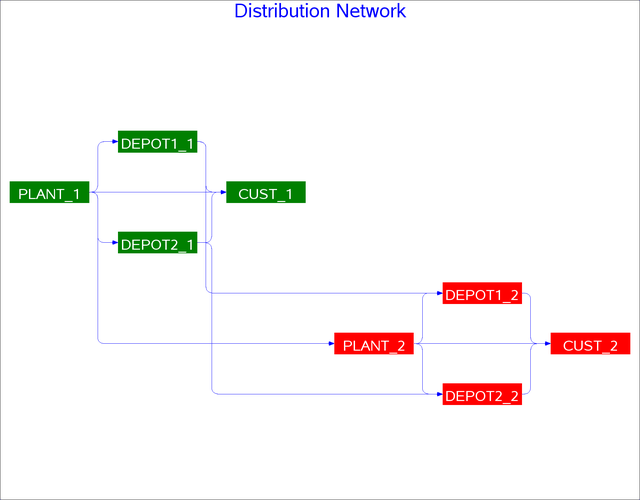
This example uses a typical problem in network flow optimization to illustrate how you can use PROC NETDRAW to draw a network by specifying completely all the node positions. Consider a simple two-period production inventory problem with one manufacturing plant (PLANT), two warehouses (DEPOT1 and DEPOT2), and one customer (CUST). In each period, the customer can receive goods directly from the plant or from the two warehouses. The goods produced at the plant can be used to satisfy directly some or all of the customer’s demands or can be shipped to a warehouse. Some of the goods can also be carried over to the next period as inventory at the plant. The problem is to determine the minimum cost of satisfying the customer’s demands; in particular, how much of the customer’s demands in each period is to be satisfied from the inventory at the two warehouses or from the plant, and also how much of the production is to be carried over as inventory at the plant? This problem can be solved using PROC NETFLOW; the details are not discussed here. Let PLANT_i represent the production at the plant in period i, DEPOT1_i represent the inventory at DEPOT1 in period i, DEPOT2_i represent the inventory at DEPOT2 in period i, and CUST_i represent the customer’s demand in period i (i =1, 2). These variables can be thought of as nodes in a network with the following data representing the COST and CAPACITY of the arcs connecting them:
          FROM      TO          COST    CAPACITY

          PLANT_1   CUST_1       10        75
          PLANT_1   DEPOT1_1      7        75
          PLANT_1   DEPOT2_1      8        75
          DEPOT1_1  CUST_1        3        20
          DEPOT2_1  CUST_1        2        10
          PLANT_1   PLANT_2       2       100
          DEPOT1_1  DEPOT1_2      1       100
          DEPOT2_1  DEPOT2_2      1       100
          PLANT_2   CUST_2       10        75
          PLANT_2   DEPOT1_2      7        75
          PLANT_2   DEPOT2_2      8        75
          DEPOT1_2  CUST_2        3        20
          DEPOT2_2  CUST_2        2        10
          CUST_1    .             .         .
          CUST_2    .             .         .
Suppose that you want to use PROC NETDRAW to draw the network corresponding to the preceding network flow problem and suppose
also that you require the nodes to be placed in specific positions. The following program saves the network information along
with the required node coordinates in the Network data set ARCS and invokes PROC NETDRAW to draw the network diagram shown in Output 9.14.1. The Network data set also contains a variable named _pattern, which specifies that pattern statement 1 be used for nodes relating to period 1 and pattern statement 2 be used for those
relating to period 2.
data arcs;
   input from $  to $  _x_ _y_ _pattern;
   datalines;
PLANT_1  CUST_1      1  5  1
PLANT_1  DEPOT1_1    1  5  1
PLANT_1  DEPOT2_1    1  5  1
DEPOT1_1 CUST_1      2  6  1
DEPOT2_1 CUST_1      2  4  1
PLANT_1  PLANT_2     1  5  1
DEPOT1_1 DEPOT1_2    2  6  1
DEPOT2_1 DEPOT2_2    2  4  1
PLANT_2  CUST_2      4  2  2
PLANT_2  DEPOT1_2    4  2  2
PLANT_2  DEPOT2_2    4  2  2
DEPOT1_2 CUST_2      5  3  2
DEPOT2_2 CUST_2      5  1  2
CUST_1     .         3  5  1
CUST_2     .         6  2  2
;
title c=blue 'Distribution Network';
pattern1 v=s  c=green;
pattern2 v=s  c=red;
proc netdraw data=arcs graphics out=netout;
   actnet / act=from succ=to separatearcs
            ybetween = 4
            centerid
            ctext = white
            carcs=blue
            htext=2
            pcompress;
   run;
Note: This network diagram can also be drawn by using suitably defined ZONE and ALIGN variables.