The CPM Procedure
- Overview
- Getting Started
-
Syntax

-
DetailsScheduling Subject to Precedence ConstraintsUsing the INTERVAL= OptionNonstandard Precedence RelationshipsTime-Constrained SchedulingFinish MilestonesOUT= Schedule Data SetMultiple CalendarsBaseline and Target SchedulesProgress UpdatingResource-Driven Durations and Resource CalendarsResource Usage and AllocationRESOURCEOUT= Usage Data SetRESOURCESCHED= Resource Schedule Data SetMultiproject SchedulingMacro Variable _ORCPM_Input Data Sets and Related VariablesMissing Values in Input Data SetsFORMAT SpecificationComputer Resource Requirements
-
ExamplesActivity-on-Node RepresentationActivity-on-Arc RepresentationMeeting Project DeadlinesDisplaying the Schedule on a CalendarPrecedence Gantt ChartChanging Duration UnitsControlling the Project CalendarScheduling around HolidaysCALEDATA and WORKDATA Data SetsMultiple CalendarsNonstandard RelationshipsActivity Time ConstraintsProgress Update and Target SchedulesSummarizing Resource UtilizationResource AllocationUsing Supplementary ResourcesINFEASDIAGNOSTIC Option and Aggregate Resource TypeVariable Activity DelayActivity SplittingAlternate ResourcesPERT Assumptions and CalculationsScheduling Course - Teacher CombinationsMultiproject SchedulingResource-Driven Durations and Resource CalendarsResource-Driven Durations and Alternate ResourcesMultiple Alternate ResourcesAuxiliary Resources and Alternate ResourcesUse of the SETFINISHMILESTONE OptionNegative Resource RequirementsAuxiliary Resources and Negative RequirementsResource-Driven Durations and Negative RequirementsStatement and Option Cross-Reference Tables
- References
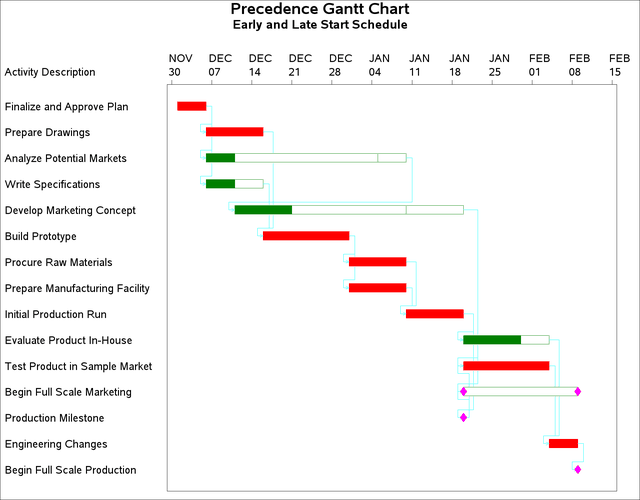
This example produces a Gantt chart of the schedule obtained from PROC CPM. The example uses the network described in Example 4.2 (AOA format) and assumes that the data set SAVE contains the schedule produced by PROC CPM and sorted by the variable E_START. The Gantt chart produced shows the early and late start schedules as well as the precedence relationships between the activities.
The precedence information is conveyed to PROC GANTT through the TAILNODE= and HEADNODE= options.
data details;
   input task $ 1-12 dept $ 15-27 descrpt $ 30-59;
   label dept = "Department"
         descrpt = "Activity Description";
   datalines;
Dev. Concept  Planning       Finalize and Approve Plan
Drawings      Engineering    Prepare Drawings
Study Market  Marketing      Analyze Potential Markets
Write Specs   Engineering    Write Specifications
Prototype     Engineering    Build Prototype
Mkt. Strat.   Marketing      Develop Marketing Concept
Materials     Manufacturing  Procure Raw Materials
Facility      Manufacturing  Prepare Manufacturing Facility
Init. Prod.   Manufacturing  Initial Production Run
Evaluate      Testing        Evaluate Product In-House
Test Market   Testing        Test Product in Sample Market
Changes       Engineering    Engineering Changes
Production    Manufacturing  Begin Full Scale Production
Marketing     Marketing      Begin Full Scale Marketing
Dummy                        Production Milestone
;

data widgeta;
   merge widgaoa details;
   run;
* specify the device on which you want the chart printed;

goptions vpos=50 hpos=80 border;

title 'Precedence Gantt Chart';
title2 'Early and Late Start Schedule';

proc gantt graphics data=save;
   chart / compress tailnode=tail headnode=head
           height=2 nojobnum skip=2
           cprec=cyan cmile=magenta
           caxis=black
           dur=days increment=7 nolegend;
   id descrpt;
   run;