Viewing a Cube in SAS OLAP Cube Studio
Overview
After you have built a cube
in SAS OLAP Cube Studio, you can examine the contents of the cube
with the View Cube function. The View Cube function is available from
the Actions menu and from the cube context
menu. The View Cube function is available for use only with physically
built cubes. In addition, when you select the View Cube function,
a connection to a SAS OLAP Server must be made.
When the View Cube
function is selected, the View Cube dialog
box is loaded and a multidimensional view of the cube data is displayed
in a table. By default, the first dimension (default hierarchy) of
the cube is displayed on the row axis and the default measure is displayed
on the column axis of the table. The dimensions that are not assigned
to a row or column are automatically assigned to the slicer axis.
The default member or ALL member is used to create the slicer filter.
You can then drill into the dimensions for the cube and see figures
for specific levels of the cube. In the View Cube dialog box, you can choose to add level selections, or you can select
the check box Replace current selection to
replace the existing levels.
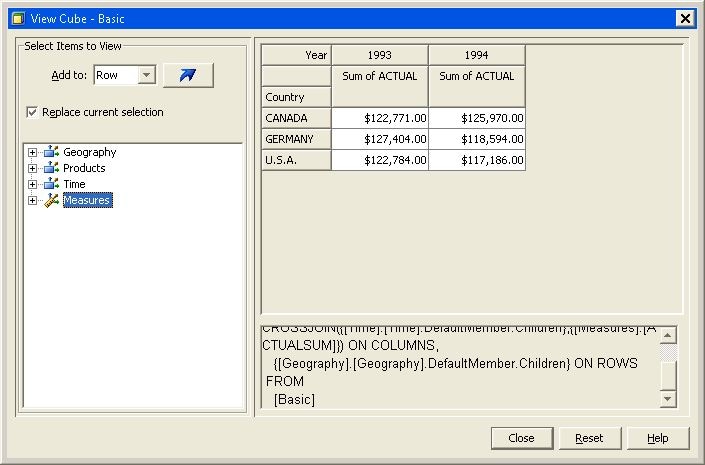
Adding Level Data to a Cube View
In this example, the
option Replace current selection is not selected.
A retailer is analyzing sales figures for outlets in various countries.
In the initial cube view, the column axis displays the default measure
for the Sum of ACTUAL sales. Displayed on
the row axis is the default hierarchy for the Geo (geography) dimension.
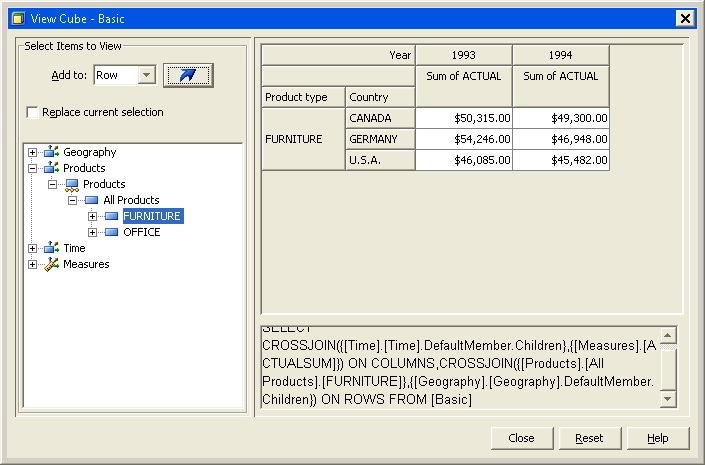
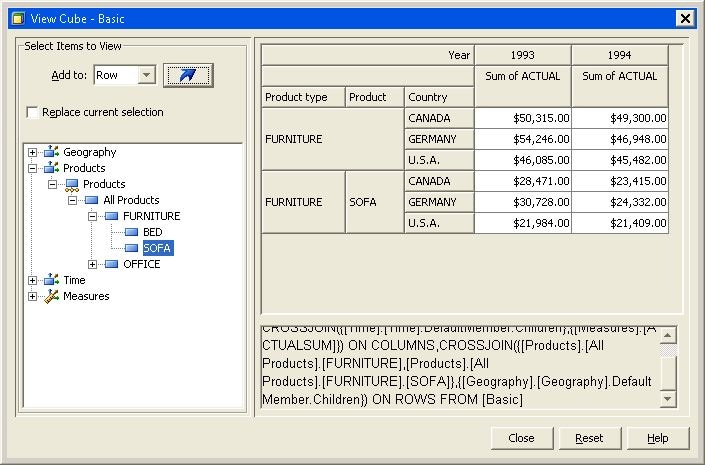
In the following display,
the row axis view is filtered on the Products dimension to the FURNITURE level. Furniture-specific
sales numbers are added to the existing row axis. The column axis
is not modified and is still filtered on the Sum of ACTUAL sales.
The following display
shows continued filtering on the FURNITURE level down to the sales figures for sofas only.
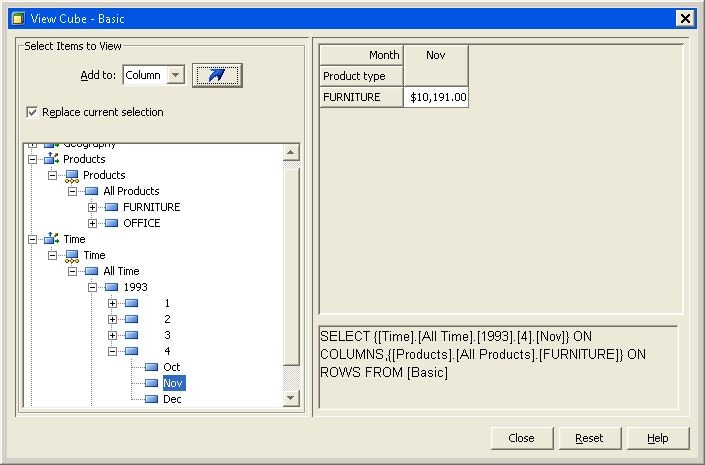
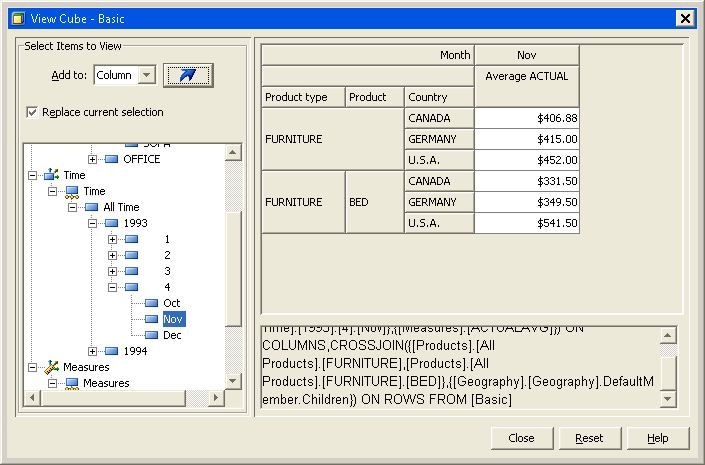
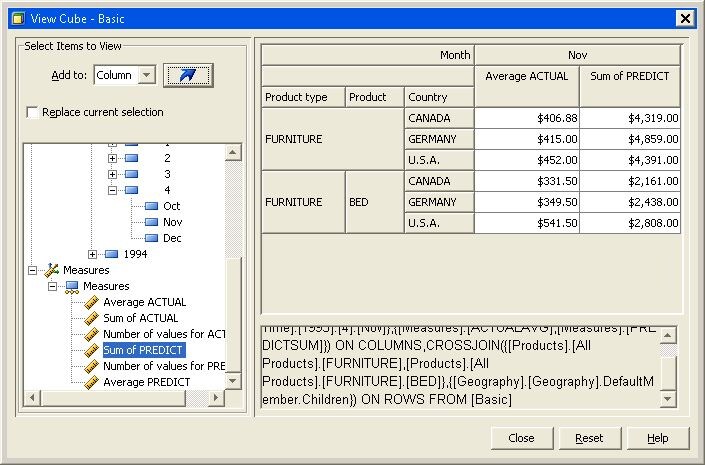
You can also filter
on the column values. In this display, the Time dimension is filtered down to the sales figures for the month of
November. In addition, the Products dimension
has been filtered on beds for the row axis.
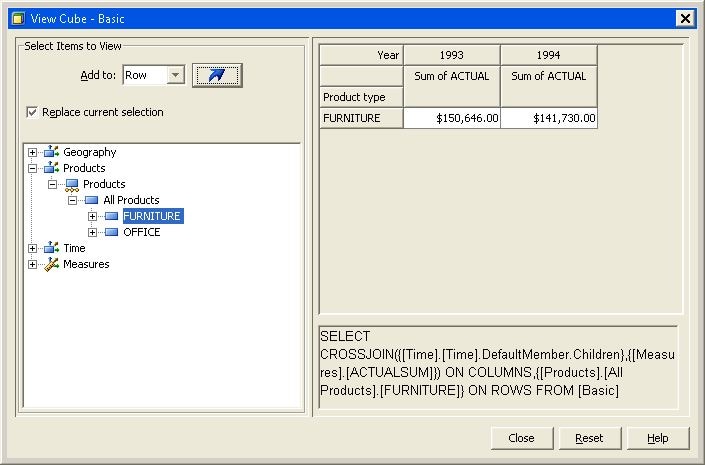
Replacing Level Data on a Cube View
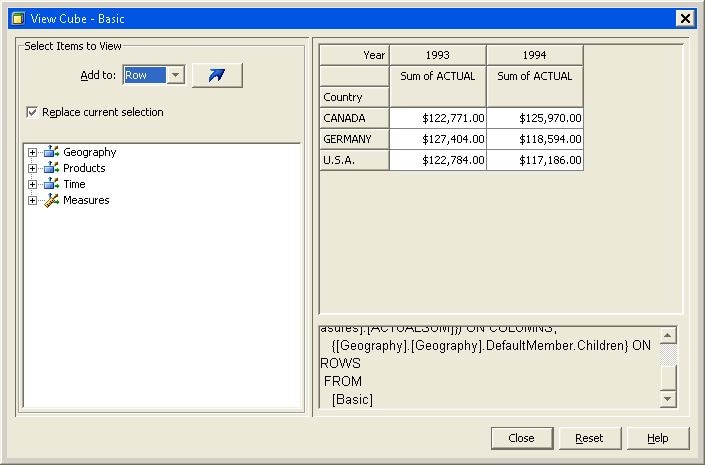
In this example, the
option Replace current selection is checked.
A retailer is analyzing sales figures for outlets in various countries.
In the initial cube view, the column axis displays the default measure
for the Sum of ACTUAL sales. Displayed on
the row axis is the default hierarchy for the Geo (geography) dimension.
In the following display,
the row axis view is filtered on the Products dimension to the FURNITURE level. Because
the Replace current selection check box is
selected, the original, default row selections were replaced. The
column axis is not modified and is still filtered on the Sum of ACTUAL sales.