Gallery of ODS Samples
LISTING Output
LISTING Output
         Average Quarterly Sales Amount by Each Sales Representative         1

--------------------------------- Quarter=1 ----------------------------------

                             The MEANS Procedure

                       Analysis Variable : AmountSold

                     N
 SalesRep          Obs      N        Mean     Std Dev     Minimum     Maximum
 ____________________________________________________________________________
 Garcia              8      8     14752.5     22806.1       495.0     63333.7

 Hollingsworth       5      5     11926.9     12165.2       774.3     31899.1

 Jensen              5      5     10015.7      8009.5      3406.7     20904.8
 ____________________________________________________________________________


         Average Quarterly Sales Amount by Each Sales Representative         2

--------------------------------- Quarter=2 ----------------------------------

                             The MEANS Procedure

                       Analysis Variable : AmountSold

                     N
 SalesRep          Obs      N        Mean     Std Dev     Minimum     Maximum
 ____________________________________________________________________________
 Garcia              6      6     18143.3     20439.6      1238.8     53113.6

 Hollingsworth       6      6     16026.8     14355.0      1237.5     34686.4

 Jensen              6      6     12455.1     12713.7      1393.7     34376.7
 ____________________________________________________________________________


         Average Quarterly Sales Amount by Each Sales Representative         3

--------------------------------- Quarter=3 ----------------------------------

                             The MEANS Procedure

                       Analysis Variable : AmountSold

                     N
 SalesRep          Obs      N        Mean     Std Dev     Minimum     Maximum
 ____________________________________________________________________________
 Garcia             21     21     10729.8     11457.0      2787.3     38712.5

 Hollingsworth      15     15      7313.6      7280.4      1485.0     30970.0

 Jensen             21     21     10585.3      7361.7      2227.5     27129.7
 ____________________________________________________________________________
         Average Quarterly Sales Amount by Each Sales Representative         4

--------------------------------- Quarter=4 ----------------------------------

                             The MEANS Procedure

                       Analysis Variable : AmountSold

                     N
 SalesRep          Obs      N        Mean     Std Dev     Minimum     Maximum
 ____________________________________________________________________________
 Garcia              5      5     11973.0     10971.8      3716.4     30970.0

 Hollingsworth       6      6     13624.4     12624.6      5419.8     38093.1

 Jensen              6      6     19010.4     15441.0      1703.4     38836.4

____________________________________________________________________________
HTML Output
With ODS, you can produce output in HTML (Hypertext Markup
Language.) You can browse these files with Internet Explorer, Netscape,
or any other browser that fully supports HTML 4.0. You do not need
to change your SAS programs to create HTML 4.0 output that contains
embedded style sheets. By default, you continue to create this type
of output even if you also create a type of output that contains different
formatting. However, if you want to add more formatting to your HTML,
use the ODS HTML statement.
XML Output
XML Output File
<?xml version="1.0" encoding="windows-1252"?>

<odsxml>
<head>
<meta operator="user"/>
</head>
<body>
<proc name="Print">
<label name="IDX"/>
<title class="SystemTitle" toc-level="1">US Census of Population and
Housing</title>
<branch name="Print" label="The Print Procedure" class="ContentProcName"
toc-level="1">
<leaf name="Print" label="Data Set Sashelp.Class" class="ContentItem"
toc-level="2">
<output name="Print" label="Data Set Sashelp.Class" clabel="Data Set
Sashelp.Class">
<output-object type="table" class="Table">

  <style>
    <border spacing="1" padding="7" rules="groups" frame="box"/>
  </style>
<colspecs columns="6">
<colgroup>
<colspec name="1" width="2" align="right" type="int"/>
</colgroup>
<colgroup>
<colspec name="2" width="7" type="string"/>
<colspec name="3" width="1" type="string"/>
<colspec name="4" width="2" align="decimal" type="double"/>
<colspec name="5" width="4" align="decimal" type="double"/>
<colspec name="6" width="5" align="decimal" type="double"/>
</colgroup>
</colspecs>
<output-head>
<row>
<header type="string" class="Header" row="1" column="1">
<value>Obs</value>
</header>
<header type="string" class="Header" row="1" column="2">
<value>Name</value>
</header>
<header type="string" class="Header" row="1" column="3">
<value>Sex</value>
</header>
<header type="string" class="Header" row="1" column="4">
<value>Age</value>
</header>
<header type="string" class="Header" row="1" column="5">
<value>Height</value>
</header>
<header type="string" class="Header" row="1" column="6">
<value>Weight</value>
</header>
</row>
</output-head>
<output-body>
<row>
<header type="double" class="RowHeader" row="2" column="1">
<value> 1</value>
</header>
<data type="string" class="Data" row="2" column="2">
<value>Alfred</value>
</data>
... more xml tagged output...
<
/odsxml>
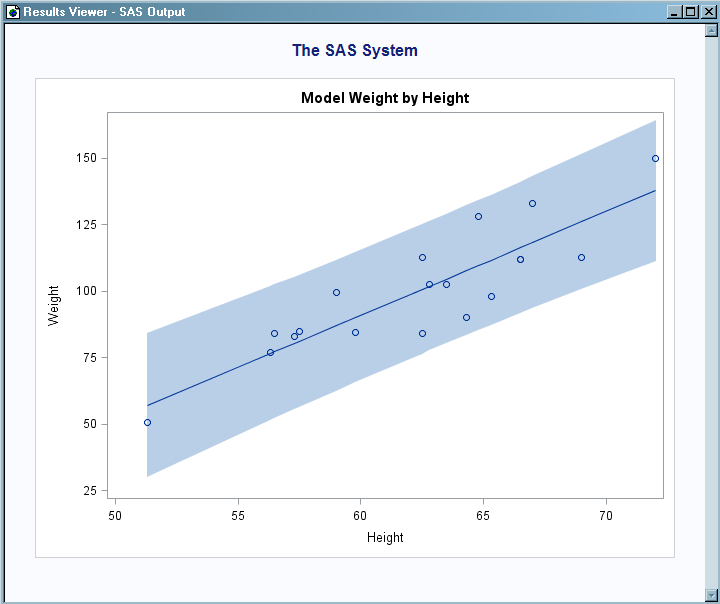
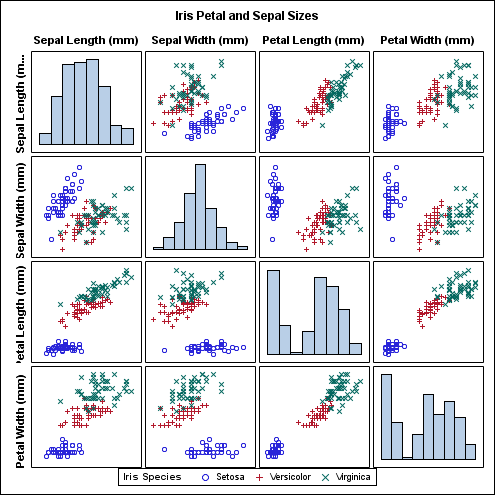
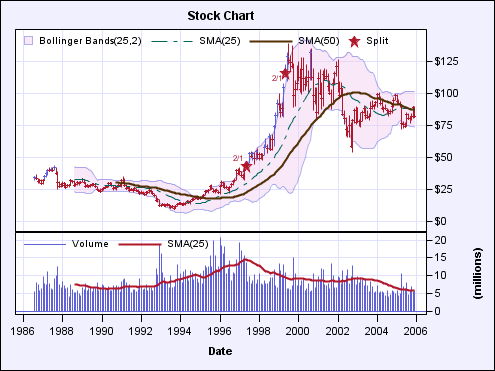
Graphical Output
The ODS Graph Template
Language (GTL) applies accepted principles of graphics design to produce
plots that are clean and uncluttered. For more information
about ODS graphics, see TEMPLATE Procedure: Creating ODS Graphics.