TEMPLATE Procedure: Creating ODS Graphics
Introduction to the Graph Template Language
Graphics are an indispensable
part of statistical analysis. Graphics reveal patterns, identify differences,
and provoke meaningful questions about your data. Graphics add clarity
to an analytical presentation and stimulate deeper investigation.
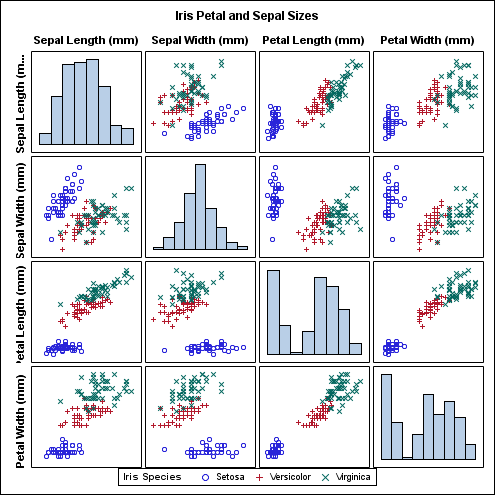
SAS 9.2 introduces the
Graph Template Language (GTL), a powerful new language for defining
clear and effective statistical graphics. The GTL enables you to generate
various types of plots, such as model fit plots, distribution plots,
comparative plots, prediction plots, and more.
The GTL applies accepted
principles of graphics design to produce plots that are clean and
uncluttered. Colors, fonts, and relative sizes of graph elements
are all designed for optimal impact. By default, the GTL produces
PNG files, which support true color (the full 24-bit RGB color model)
and enable visual effects such as anti-aliasing and transparency,
but retain a small file size. GTL statement options enable you to
control the content and appearance of the plot down to the smallest
detail.
The GTL is designed
to produce graphics with minimal syntax. The GTL uses a flexible,
building-block approach to create a graph by combining statements
in a template called a STATGRAPH template. STATGRAPH templates are
defined with the TEMPLATE procedure.
You can create custom
graphs by defining your own STATGRAPH templates. To create a custom
graph, you must perform the following steps:
With a few statements,
you can create the plots that you need to analyze your data. For example,
you can create the following model fit plot with these statements:
proc template;
define statgraph mytemplate;
beginGraph;
   entrytitle "Model Weight by Height";
   layout overlay;
   bandplot x=height limitupper=upper limitlower=lower;
   scatterplot y=weight x=height;
   seriesplot y=predict x=height;
endlayout;
endGraph;
end;
run;

proc sgrender data=sashelp.classfit
              template=mytemplate;
run;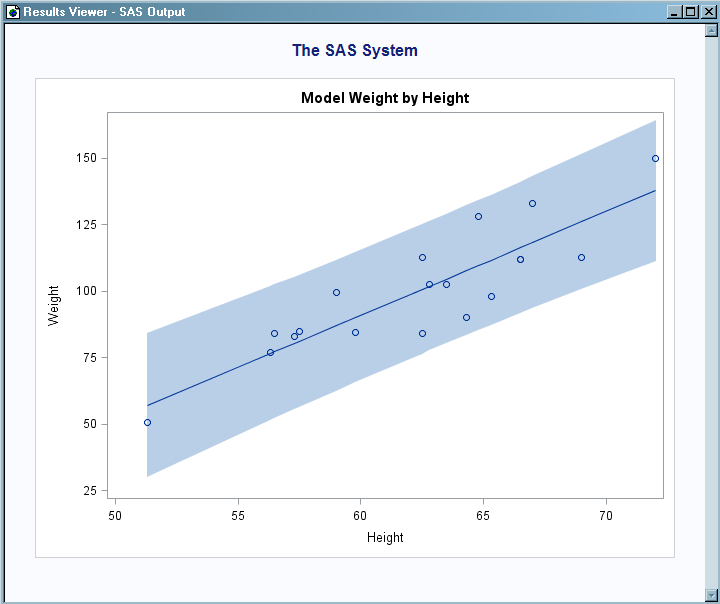
This example defines
a STATGRAPH template named
mytemplate, which
uses values from the data set Sashelp.Classfit. This data set contains
data variables HEIGHT and WEIGHT and precomputed values for the fitted
model (PREDICT) and confidence band (LOWER and UPPER). The SGRENDER
procedure uses the data in Sashelp.Classfit and the template mytemplate to render the graph. (This example is member
GTLMFIT1 in the SAS Sample Library.)