Working with the TEMPLATE Procedure
Introduction to the TEMPLATE Procedure
The TEMPLATE procedure enables you
to customize the appearance of your SAS output. For example, you can
create, extend, or modify existing templates for various types of
output, such as the following:
ODS uses these templates to produce formatted output.
-
styles
-
tables
-
crosstabulation tables
-
columns
-
headers
-
footers
-
tagsets
-
ODS Graphics
You can use
the TEMPLATE procedure to navigate and manage the templates stored
in template stores. Here are some tasks that you can do with PROC
TEMPLATE:
-
Edit an existing template.
-
Create links to an existing template.
-
Change the location where you write new templates.
-
Search for existing templates.
-
View the source code of a template.
What Can You Do with the TEMPLATE Procedure?
Modify a Table Template That a SAS Procedure Uses
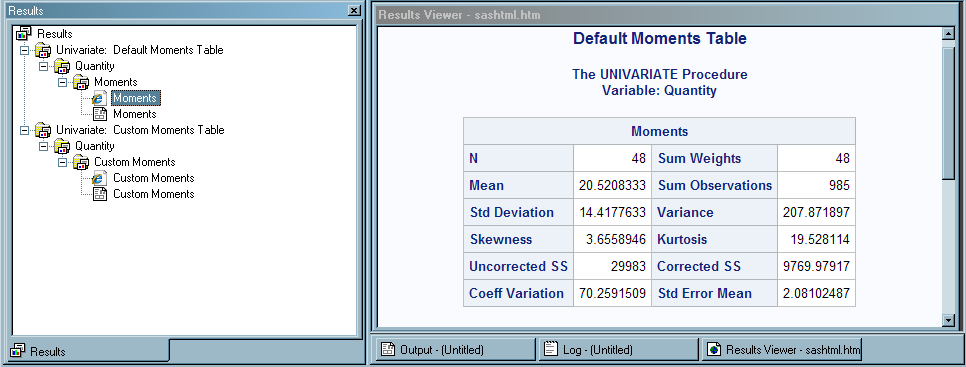
The
following output shows the use of a customized table template for
the Moments output object using PROC UNIVARIATE. The program that
creates the modified table template does the following:
-
Creates and edits a copy of the default table template.
-
Edits a header in the table template.
-
Sets column attributes to enhance the appearance of the HTML output.
To view the code that
creates the following output, see Editing a Table Template That a SAS Procedure Uses in SAS Output Delivery System: Procedures Guide.
Default Moments Table
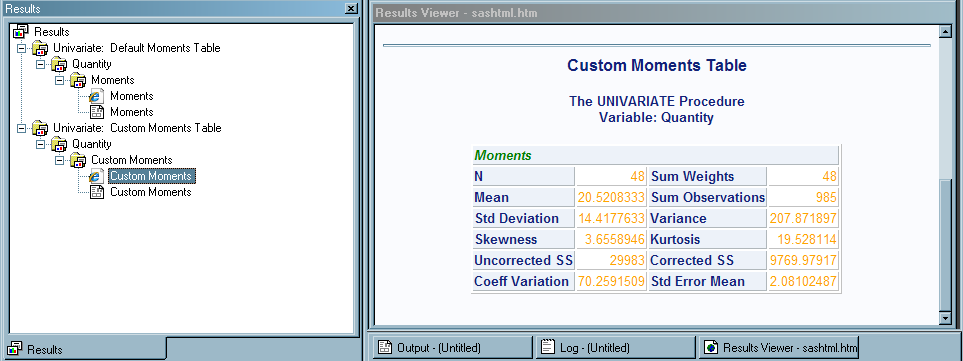
Customized Moments Table (Customized HTML Output from PROC
UNIVARIATE and Viewed with Microsoft Internet Explorer)
Modify a Style
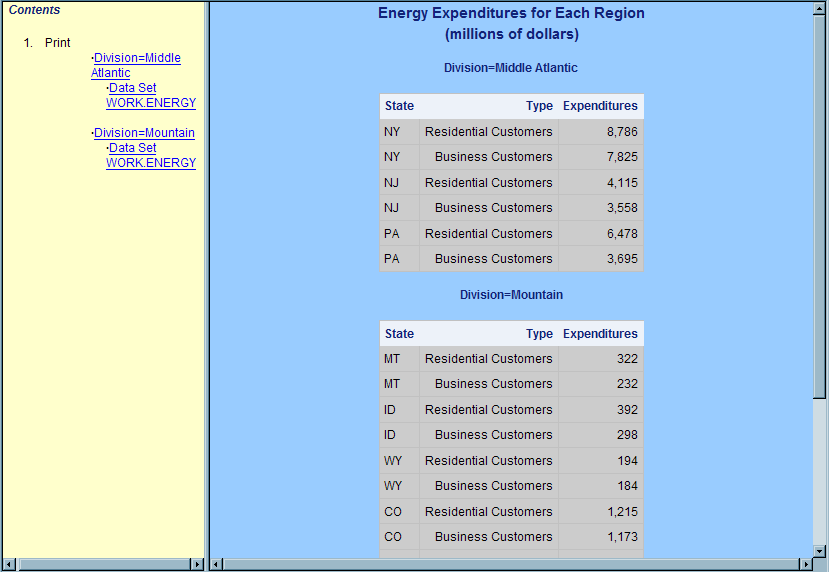
When
you are working with styles, you are more likely to modify a style
that SAS provides than create a completely new style. The following
output uses the Styles.HTMLBlue template that SAS provides and includes
changes made to the style to customize the output’s appearance. To view the code that
creates this output, see Modifying the Default Style with the CLASS Statement in SAS Output Delivery System: Procedures Guide.
In the contents file,
changes to the style are to the following:
-
The text of the header and the text that identifies the procedure that produced the output.
-
The colors for some of the text.
-
The font size for some of the text.
-
The spacing in the entries in the table of contents.
In the body file, changes
to the style are to the following:
-
Two of the colors in the color list. One of these colors is used as the foreground color for the table of contents, the BY line, and column headings. The other color is used as the foreground color for many parts of the body file, including SAS titles and footnotes.
-
The font size for titles and footnotes.
-
The font style for headers.
-
The presentation of the data in the table by changing attributes like cell spacing, rules, and border width.
HTML Output (Viewed with Microsoft Internet Explorer)
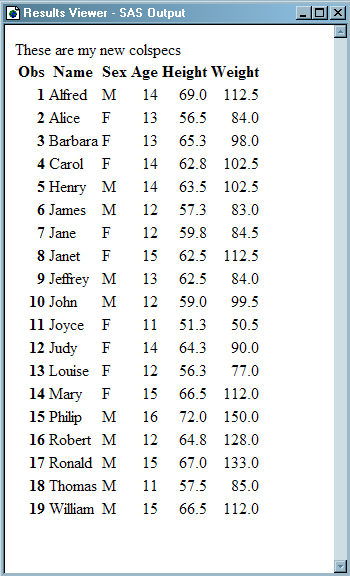
Create Your Own Tagset
Tagsets are used to create custom markup output. You
can create your own tagsets, extend existing tagsets, or modify a
tagset that SAS provides. The following display shows the results
from a new tagset named TAGSET.MYTAGS.
To see the customized
MYTAGS.CHTML tagset, view the source by selecting View Source from
your web browser’s toolbar.
Source from
your web browser’s toolbar.
MYTAGS.CHTML Output (Viewed with Microsoft Internet Explorer)
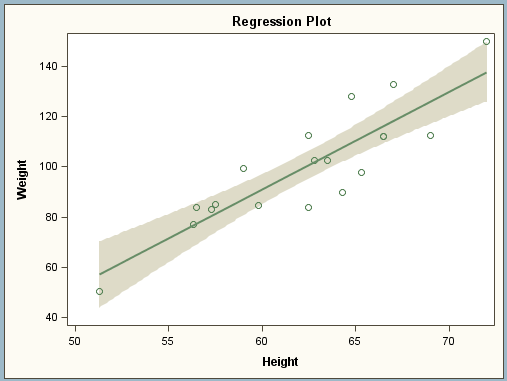
Create a Template-Based Graph
StatGraph templates
create output called ODS Graphics. For complete information, see SAS Graph Template Language: User’s Guide.
The following code creates
the StatGraph template MyGraphs.Regplot, which creates the following
graph:
proc template;
define statgraph mygraphs.regplot;
begingraph;
  entrytitle "Regression Plot";
  layout overlay;
	modelband "mean";
    scatterplot x=height y=weight;
	regressionplot x=height y=weight / clm="mean";
  endlayout;
endgraph;
end;
run;

ods listing style=analysis;
ods graphics / reset imagename="reg" width=500px;

proc sgrender data=sashelp.class template=mygraphs.regplot;
run;
The following display
shows a scatterplot with an overlaid regression line and confidence
limits for the mean of the HEIGHT and WEIGHT variables of a data set.
Scatterplot Created with a StatGraph Template
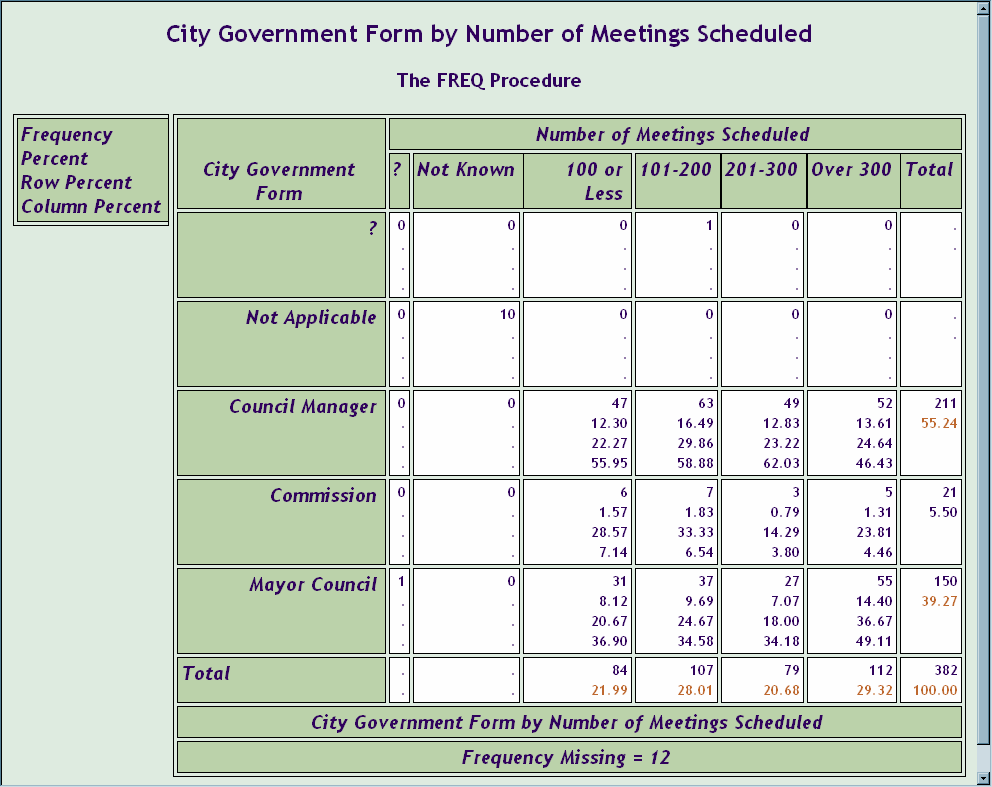
Modify a Crosstabulation Table
The TEMPLATE procedure enables you to customize the appearance
of crosstabulation (contingency) tables that are created with the
FREQ procedure. By default, crosstabulation tables are formatted based
on the CrossTabFreqs template that SAS provides. However, you can
create a customized CrossTabFreqs template using the TEMPLATE procedure
with the DEFINE CROSSTABS statement. To view the SAS code
that creates this output, see Creating a Crosstabulation Table Template with a Customized Legend in SAS Output Delivery System: Procedures Guide.
The following output
shows the use of a customized CrossTabFreqs template for the CrossTabFreqs
table. The program that creates the customized CrossTabFreqs template
does the following:
-
Modifies table regions.
-
Customizes legend text.
-
Modifies headers and footers.
-
Modifies variable labels used in headers.
-
Customizes styles for cellvalues.
Customized CrossTabFreqs Template for the CrossTabFreqs Table
Copyright © SAS Institute Inc. All Rights Reserved.