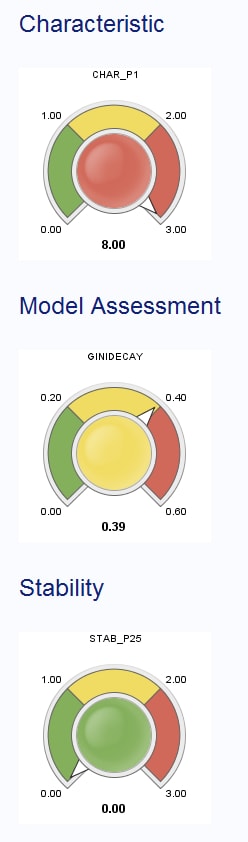
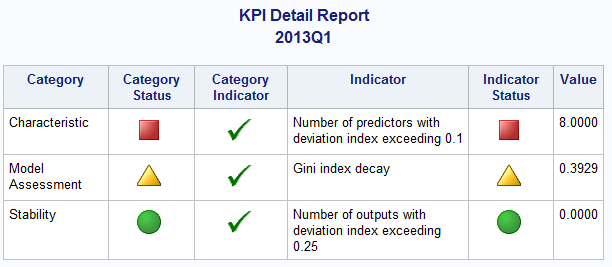
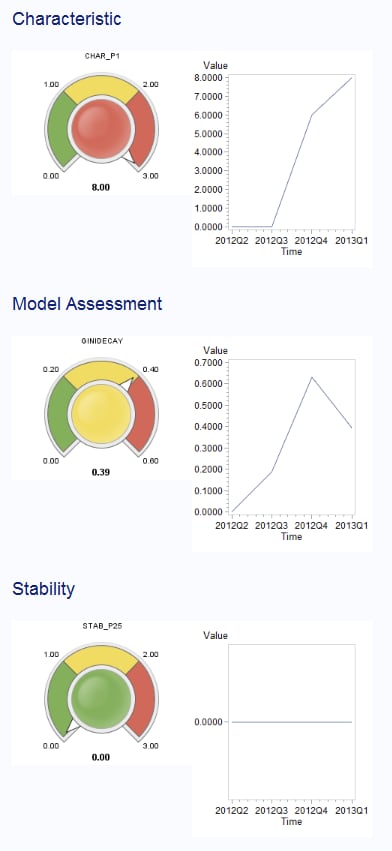
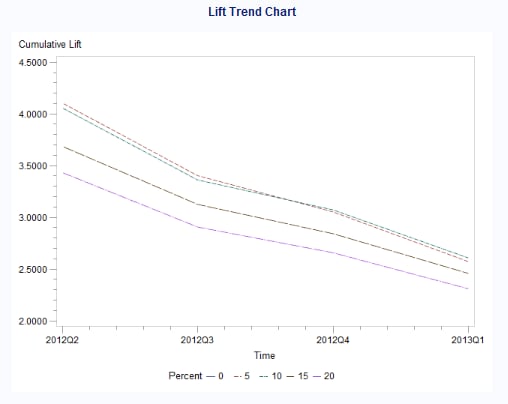
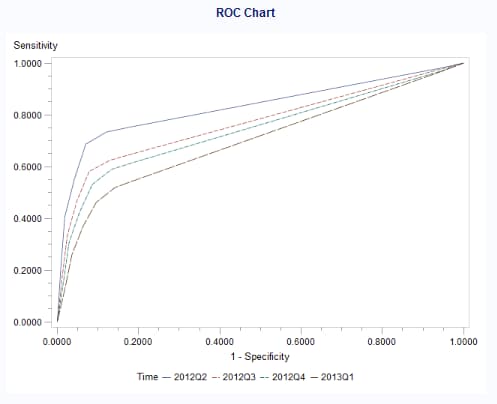
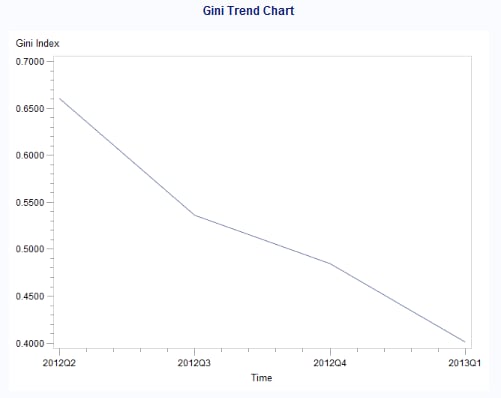
Here are several examples
of the graphs that are displayed in the Monitoring Report for the
HMEQ project.
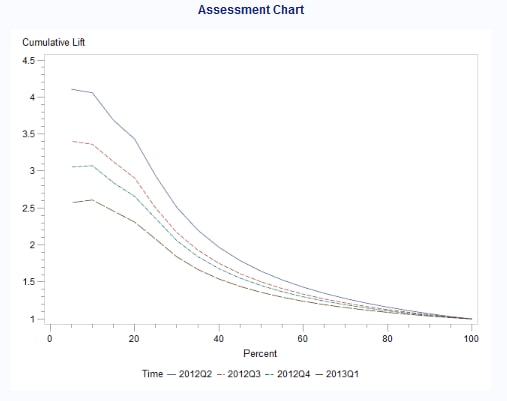
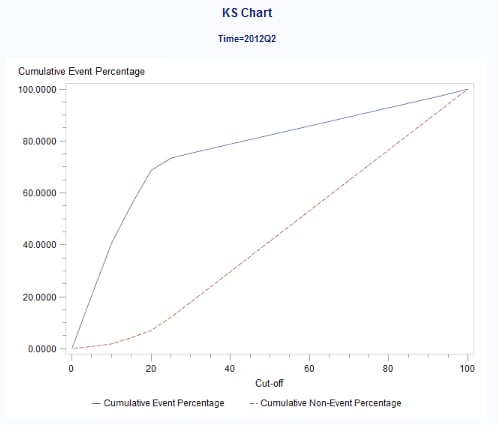
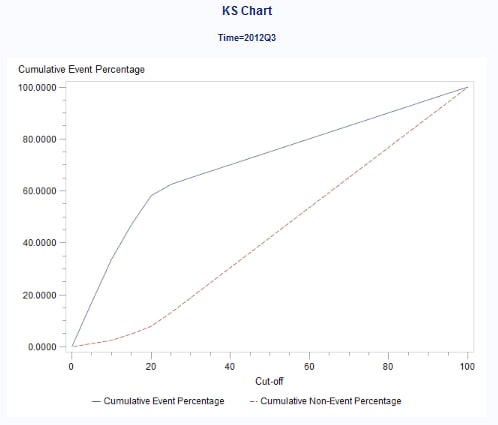
A KS Chart for each
time frame is displayed on the Monitoring Report. Here are examples
for the second and third quarters of 2012.
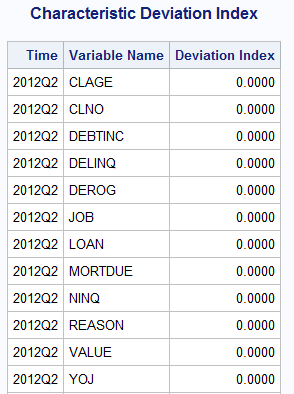
The following is a
partial output of a Characteristic Deviation Index Table: