Overview of Model Comparison, Validation, and Summary Reports
What Are Model Comparison, Validation, and Summary Reports?
The SAS Model Manager
model comparison, validation, and summary reports are tools that you
can use to evaluate and compare the candidate models in a version
or across versions to help you select and approve the champion model
that moves to production status. The SAS Model Manager model comparison
reports are analytical tools that project managers, statisticians,
and analysts can use to assess the structure, performance, and resilience
of candidate models. The model validation reports use statistical
measures to validate the stability, performance, and calibration of
Basel II risk models and parameters. The training summary data set
report creates frequency and distribution charts that summarize the
train table variables.
The reports present
information about a number of attributes that can affect model performance.
Together, the reports provide qualified information that can serve
as the analytical basis for choosing and monitoring a champion model.
Here is a description
of the comparison reports:
For a single model,
this report displays the profile data that is associated with input,
output, and target variables. Profile data includes the variable name,
type, length, label, SAS format, measurement level, and role.
The Dynamic Lift report
provides visual summaries of the performance of one or more models
for predicting a binary outcome variable.
These are the Basel
II model validation reports:
The Loss Given Default
(LGD) report calculates the amount that might be lost in an investment
and calculates the economic or regulatory capital for Basel II compliance.
The model validation
reports use statistical measures that report on these model validation
measures:
This is the train table
data set summary report:
The Model Comparison, Validation, and Summary Report Input Files
SAS Model Manager uses
a test table as the input table for the Dynamic Lift report and the
Interval Target Variable report.
Before you can create
a Dynamic Lift report or the Interval Target Variable report, make
sure that a test table has been added to the SAS Metadata Repository
using SAS Management Console or that a libref has been defined in
the Edit Start-up Code window for the SAS
library where the test table resides. The test table can be viewed
in the Data Sources category view. Then, specify the test table in
the project property Default Test Table.
You specify the input
table for Basel II validation reports in the New Report window.
The input file for the validation reports can contain only input variables
or it can contain input and output variables. If the input table contains
input and output variables, the report generation does not need to
run a scoring task to obtain the output variables.
To create the input
table for the training summary data set report, make sure that the
train table has been added to the SAS Metadata Repository or that
a libref has been defined in the Edit Start-up Code window
for the train table library. The train table must be specified in
the project or version property for Default Train Table.
The Model Comparison, Validation, and Summary Report Output Files
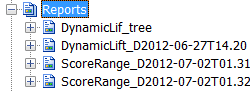
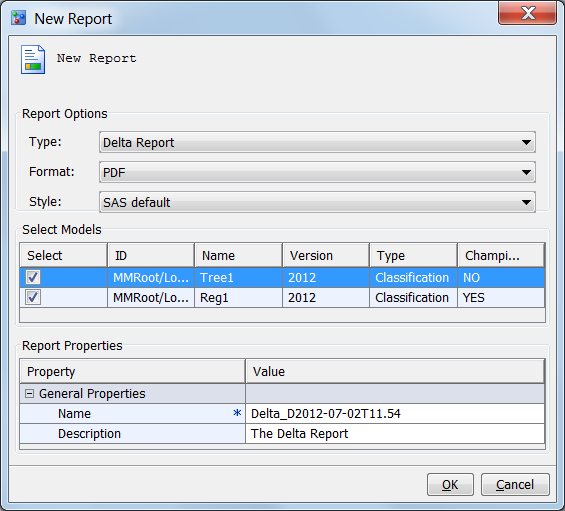
The New
Reports window stores the model comparison, validation,
and summary report output files in a report node under the Reports node.
The name of the report node is the value of the Name box
that you specified in the New Report window Report
Properties table.