To create the monitoring
reports, you run the
Define Performance Task wizard
to generate SAS code. You then execute the generated code. Execution
of the generated code creates the SAS data sets that are used to display
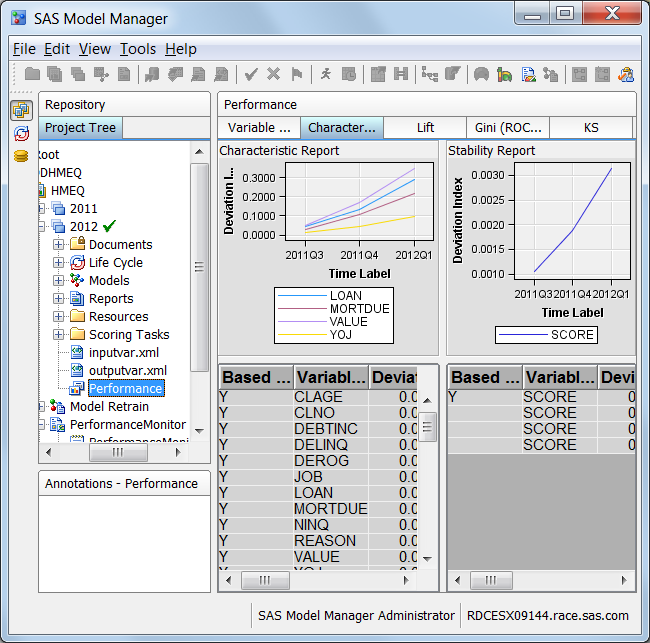
the monitoring reports from the version
Performance node,
or the Monitoring Report or Champion and Challenger Performance Report
that you create from the
New Report wizard.
To create the reports,
follow these steps:
-
Right-click the project
name and select
Define Performance Task. The
Define
Performance Task wizard appears.
Note: The
Define Performance
Task pop-up menu item is available to only SAS Model
Manager administrators and advanced users.
-
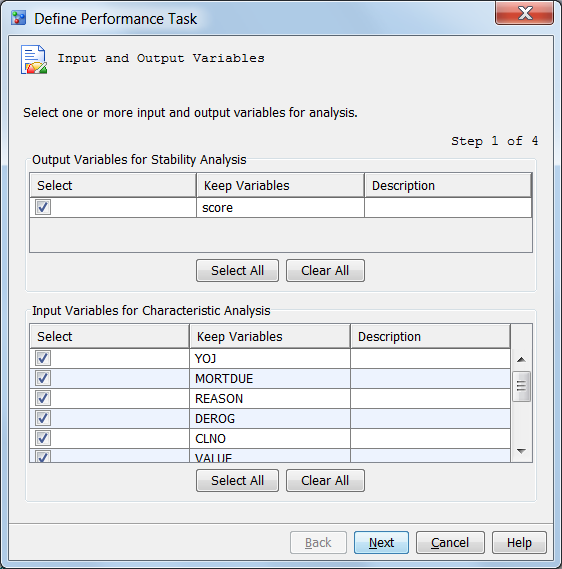
In the
Output
Variables for Stability Analysis table, select the output
variable or variables. To select all output variables, click
Select
All.
-
In the
Input
Variables for Characteristic Analysis table, select the
input variables. To select all input variables, click
Select
All. Click
Next.
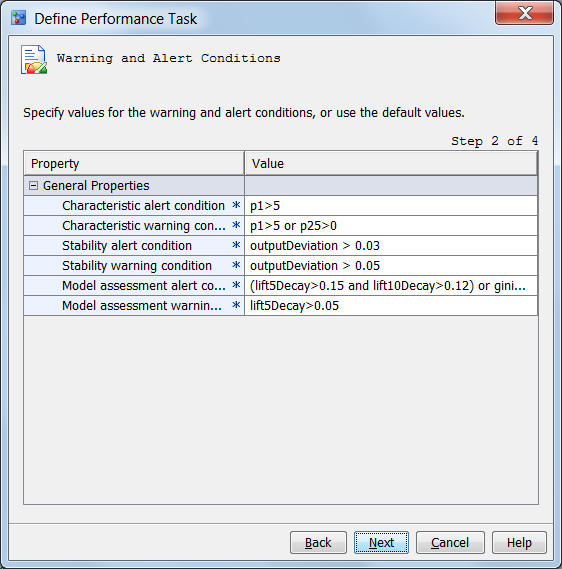
-
For each general property
in the table, verify the values for the warning and alert conditions.
Modify the values as necessary. Make sure that the values are not
enclosed in quotation marks. Click
Next.
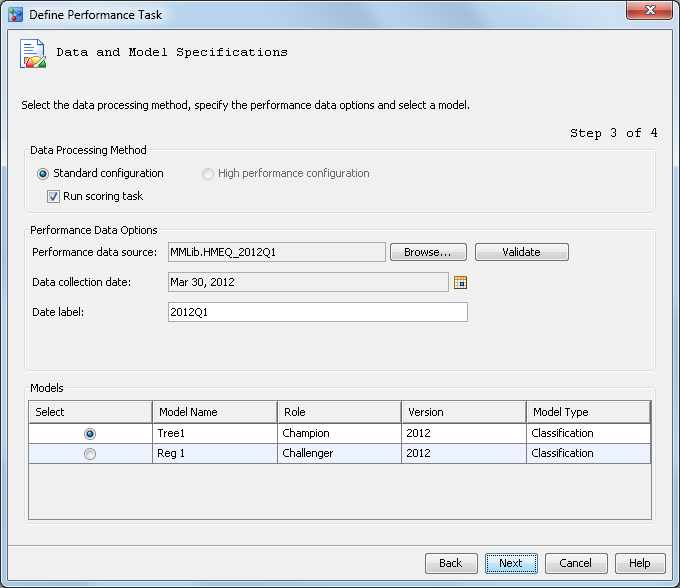
-
Choose the data processing
methods.
-
To run a standard environment,
select
Standard configuration.
-
To run the performance monitoring
task in a High Performance Analytic environment, select
High
performance configuration.
-
To run the scoring task code in
the performance monitor job, select
Run scoring task.
If
High performance configuration is selected,
the
Run scoring task check box is not available.
Note: The scoring task is not run
when
High performance configuration is selected.
To use the high performance configuration, the High Performance Analytics
server product must be licensed.
-
Click the
Performance
data source Browse button and
select a performance data source from the folder that contains the
performance data set.
-
(Optional) Click
Validate to
verify that the selected input variables and target variables are
included in the performance data source.
-
Click the calendar button

for the
Data collection date box
and select a date. The date can be any date in the time period when
the performance data was collected. SAS Model Manager uses the date
value to sequence data. Therefore, you can select any date in the
time period when the performance data source was collected.
-
To add a label for the
date, enter the label in the
Date label field.
The date label represents the time point of the performance data source.
Because the date label appears in the performance charts, use a label
that is short and understandable (for example, 2012Q1 or 2012).
If the performance monitoring
report is for a challenger model and the data will be used in a Champion
and Challenger Performance report, the value of the
Date
label field must be the same date label that was used
for the same time period when the performance monitoring report was
run for the champion model. For example, if the date label for the
champion model’s data from the first quarter of 2012 is 2012Q1,
the date label for the challenger model’s data from the first
quarter of 2012 must be 2012Q1.
-
Select a model from
the
Models table. If a challenger model has
been flagged, the challenger model is listed in the
Models table.
-
-
(Optional) To send the
scoring results by e-mail, click the
Add button
in the
E-mail Notifications table. The
Add
Contact window appears.
-
Type in an e-mail address.
-
Select either
Yes or
No if
you want an alert warning to be sent by e-mail when alert or warning
thresholds have been exceeded.
-
Select either
Yes or
No if
you want a completion notice with the job status to be sent by e-mail
every time the report runs.
-
Click
Finish.
The
Working status box appears while the
code is generated.
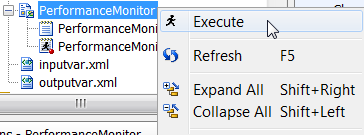
-
To execute the generated
code, right-click the
PerformanceMonitor folder
and select
Execute. The performance task is
executed as a background process. SAS Model Manager saves the data
sets that create the monitoring reports in the
Resources folder
of the default version.
Note: If the report creation fails,
you can view the SAS log to look for error messages by selecting the
PerformanceMonitor.log file in the
PerformanceMonitor node.
-
To view the reports,
click the
Performance node. On the right,
click the tab for the report that you want to view.