Monitoring Resources
Grid Monitor Window
The Grid
Monitor window view of the monitor shows one node for
each machine in the cluster. When you place your pointer over a node
icon, a tooltip shows the resource use on the machine.
Grid Monitor Node View
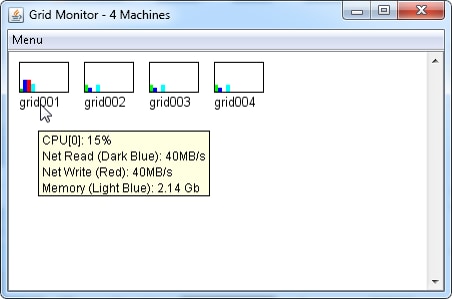
In the preceding display,
the grid001 machine is distributing data to the other three machines
in the cluster. The red line indicates that it is writing data on
the network and the smaller blue lines on the other icons indicate
that they are reading data. There is a CPU[n] display
in the tooltip for each core on the machine. In most cases, there
are 24 or more cores shown. Each of the cores is also represented
by a green line on the node icon.
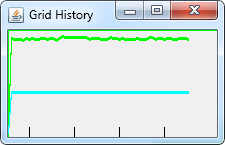
Viewing History
The monitor offers two
views of historic resource use. The first is a cumulative view of
all the machines. The second view is for an individual machine. Both
views show 60 seconds of historic activity.
The cumulative view
for all the machines is shown after you select Menu Show Grid History. The green line shows the average CPU utilization
and the blue line shows the average memory use.
Show Grid History. The green line shows the average CPU utilization
and the blue line shows the average memory use.
If you select a node
icon in the node view, right-click, and select Show History
Graph, then the monitor opens a window that shows the
historic resource usage for that machine.
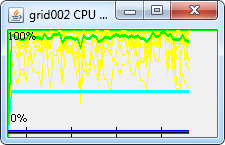
The indicators are as
follows:
-
Green Shows the average CPU usage for all the cores in the machine.
-
Yellow Each line shows the CPU usage for one core.
-
Light blue Shows the memory usage for the machine.
-
Dark blue Shows the network read speed as a percent.
-
Red Shows the network write speed as a percent.
For the network read
and write percentages, when the monitor connects to the cluster, it
determines the network interface speed, typically 1G or 10G Ethernet.
Copyright © SAS Institute Inc. All Rights Reserved.