Language Reference
SCATTER Call
CALL SCATTER (x,y <*>GROUP=GroupVector <*>DATALABEL=LabelVector <*>OPTION=ScatterOption <*>GRID={"X" <,"Y">} <*>LABEL={XLabel <,YLabel>} <*>XVALUES=xValues<*>YVALUES=yValues<*>PROCOPT=ProcOption<*>LINEPARM={x0 y0 slope} <*>OTHER=Stmts );
The SCATTER subroutine displays a SCATTER plot by calling the SGPLOT procedure. The arguments x and y are vectors that contain the data to plot. The SCATTER subroutine is not a comprehensive interface to the SGPLOT procedure. It is intended for creating simple scatter plots for exploratory data analysis. The ODS statistical graphics subroutines are described in Chapter 16: Statistical Graphics.
A simple example follows:
use sashelp.cars;
read all var {MPG_City MPG_Highway};
close sashelp.cars;

title "Scatter Plot with Default Properties";
run Scatter(MPG_City, MPG_Highway) label={"MPG_City" "MPG_Highway"};
Figure 25.357: A Scatter Plot
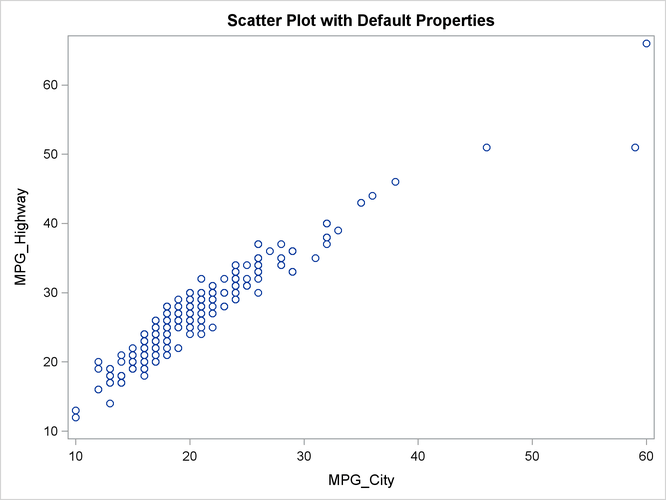
Specify the x vector inside parentheses and specify all options outside the parentheses. Use the global TITLE and FOOTNOTE statements to specify titles and footnotes. Each option corresponds to a statement or option in the SGPLOT procedure.
The following options correspond to options in the SCATTER statement in the SGPLOT procedure:
- GROUP=
-
specifies a vector of values that determine groups in the plot. You can use a numeric or character vector. This option corresponds to the GROUP= option in the SCATTER statement.
- DATALABEL=
-
specifies a vector of values that label each marker in the plot. You can use a numeric or character vector.
- OPTION=
-
specifies a character matrix or string literal. The value is used verbatim to specify options in the SCATTER statement.
The SCATTER subroutine also supports the following options. The BAR subroutine documents these options and gives an example of their usage.
- GRID=
-
specifies whether to display grid lines for the X or Y axis.
- LABEL=
-
specifies axis labels for the X or Y axis.
- XVALUES=
-
specifies a vector of values for ticks for the X axis.
- YVALUES=
-
specifies a vector of values for ticks for the Y axis.
- PROCOPT=
-
specifies options in the PROC SGPLOT statement.
- OTHER=
-
specifies statements in the SGPLOT procedure.
In addition, the LINEPARM= option specifies a three-element vector whose elements specify the X=, Y= and SLOPE= options, respectively, on the LINEPARM statement.
The following example creates several scatter plots with various options. Each scatter plot is documented in the program comments.
/* define data */
call randseed(1);
x = do(-5, 5, 0.25);
y = x/5 + sin(x) + RandFun(1||ncol(x), "Normal");
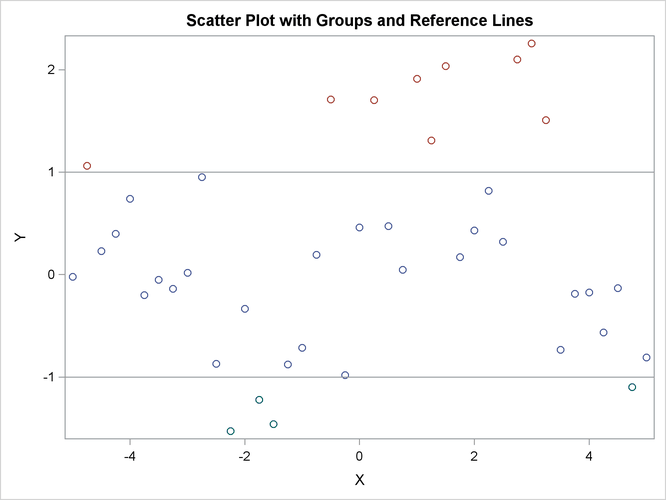
title "Scatter Plot with Groups and Reference Lines";
/* 1. Use the GROUP= option to assign a group to each observation
* 2. Use the OTHER= option to add reference lines to the Y axis
* 3. Use the PROCOPT= option to suppress the legend
*/
g = j(ncol(x), 1, 1);
g[ loc(y>=1) ] = 2;
g[ loc(y< -1) ] = 3;
run Scatter(x, y) group=g /* assign color/marker shape */
other="refline -1 1 / axis=y" /* add reference line */
procopt="noautolegend"; /* PROC option */
Figure 25.358: Group Attributes and Reference Lines
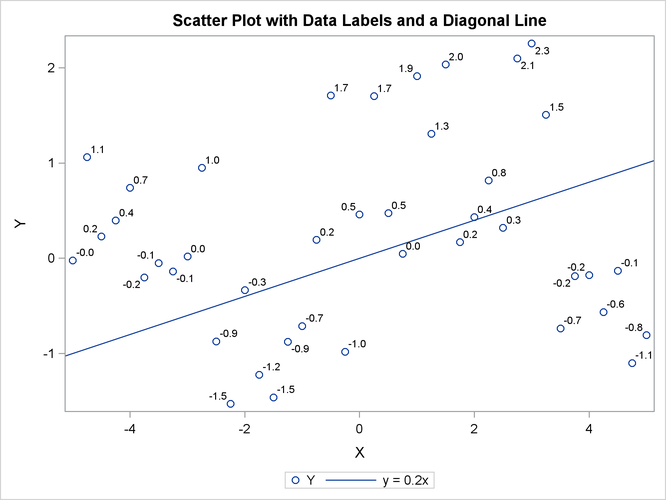
title "Scatter Plot with Data Labels and a Diagonal Line";
/* 1. Use the DATALABEL= option to label each marker
 * 2. Use the LINEPARM= option to add line passing through
 *    (0,0) with slope=0.2
 */
dlabels = putn(y, "4.1");
run Scatter(x, y) datalabel=dlabels    /* label each marker */
                  lineparm={0 0 0.2};  /* line through (0,0) with slope 0.2 */
Figure 25.359: Data Labels and Diagonal Line
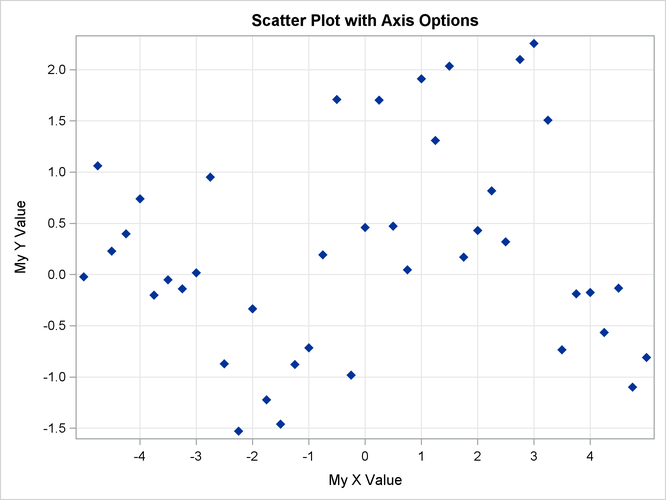
title "Scatter Plot with Axis Options";
/* 1. Use the OPTION= option to specify marker attributes
 * 2. Use the GRID= option to add a reference grid
 * 3. Use the LABEL= option to specify axis labels
 * 4. Use the XVALUES= and YVALUES= options to specify tick positions
 */
call Scatter(x,y) option="markerattrs=(symbol=DiamondFilled)"
                  grid= {X Y}
                  label={"My X Value" "My Y Value"}
                  xvalues = -4:4
                  yvalues = do(-2,2,0.5);
Figure 25.360: Marker and Axis Attributes