Statistical Graphics
How the Graphs Are Created
This section provides a simple example that demonstrates how the ODS statistical graphics subroutines work.
Suppose you want to create a bar chart of some discrete data that are contained in a SAS/IML matrix. One way to create the bar chart would be to write the data to a SAS data set, quit PROC IML, and call the SGPLOT procedure. However, you might prefer to create the bar chart without exiting from PROC IML. You can do this by using the SUBMIT and ENDSUBMIT statements, as follows:
proc iml;
x = {[7]A [8]B [3]C};  /* repetition factors: 7 As, 8 Bs, and 3 Cs */
create Bar var {x}; append; close Bar;       /* write SAS data set */

submit;
   proc sgplot data=Bar;
      vbar x;
   run;
endsubmit;
Figure 16.1: Bar Chart
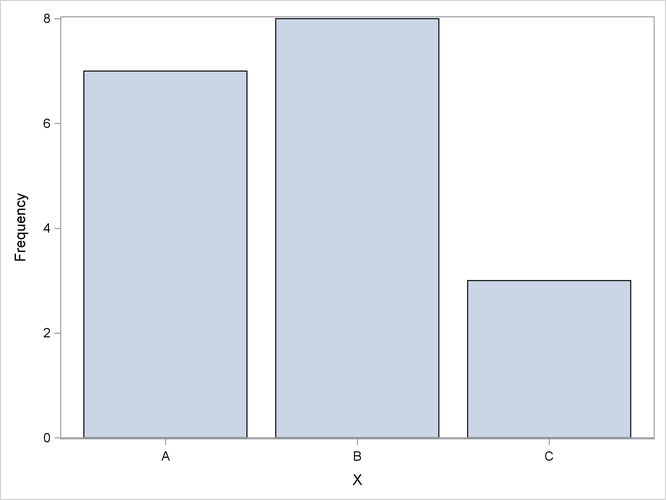
The result is shown in Figure 16.1. The graph is created by calling the SGPLOT procedure from within a SAS/IML program. Of course, you can also encapsulate these statements into a module that creates a bar chart from the data, as follows:
/* module to create a bar chart from data in X */
start BarChart(x);
   create Bar var {x}; append; close Bar;  /* write to SAS data set  */
   submit;
      proc sgplot data=Bar;                /* create the plot     */
         vbar x;
      run;
   endsubmit;
   call delete("Bar");                     /* delete the data set */
finish;

run BarChart(x);                           /* call the module     */
This program illustrates the basic idea of the ODS statistical graphics subroutines that are available in the IMLMLIB module library. The modules write data to a data set and call PROC SGPLOT to create a graph. The subroutines also accept additional parameters that determine options in the graph.