Language Reference
The PALETTE function is part of the IMLMLIB library . The PALETTE function returns a palette of colors that are suitable for using in a discrete heat map or a choropleth map. The colors are appropriate to use for the COLORRAMP= option of the HEATMAPDISC subroutine .
The following example gets several color palettes:
BuGn4 = Palette("BuGn", 4);
BrBG5 = Palette("BrBG", 5);
Past6 = Palette("Pastel1", 6);
print BuGn4, BrBG5, Past6;
The color specification and palette names were designed by Cynthia Brewer (Brewer, 2013) and are described at http://ColorBrewer.org. The color schemes are copyright 2002 by Cynthia Brewer, Mark Harrower, and The Pennsylvania State University. The ColorBrewer color schemes are made available under the Apache License, Version 2.0.
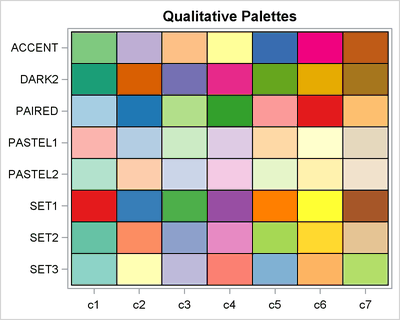
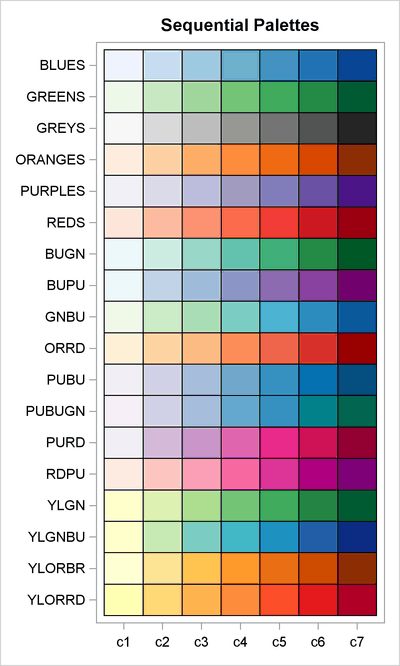
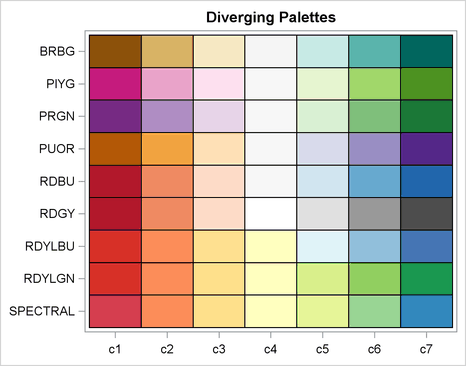
The sequential schemes support between three and nine colors. The diverging schemes support between three and 11 colors. The qualitative schemes support between three and eight colors, with some palettes supporting as many as 12 colors. Table 24.2–Table 24.4 show the names of the color palettes and the number of colors that each supports.
Table 24.2: Sequential Color Schemes
|
Name |
Max Colors |
|---|---|
|
BLUES |
9 |
|
GREENS |
9 |
|
GREYS |
9 |
|
ORANGES |
9 |
|
PURPLES |
9 |
|
REDS |
9 |
|
BUGN |
9 |
|
BUPU |
9 |
|
GNBU |
9 |
|
ORRD |
9 |
|
PUBU |
9 |
|
PUBUGN |
9 |
|
PURD |
9 |
|
RDPU |
9 |
|
YLGN |
9 |
|
YLGNBU |
9 |
|
YLORBR |
9 |
|
YLORRD |
9 |
Table 24.3: Diverging Color Schemes
|
Name |
Max Colors |
|---|---|
|
BRBG |
11 |
|
PIYG |
11 |
|
PRGN |
11 |
|
PUOR |
11 |
|
RDBU |
11 |
|
RDGY |
11 |
|
RDYLBU |
11 |
|
RDYLGN |
11 |
|
SPECTRAL |
11 |
Table 24.4: Qualitative Color Schemes
|
Name |
Max Colors |
|---|---|
|
ACCENT |
8 |
|
DARK2 |
8 |
|
PAIRED |
12 |
|
PASTEL1 |
9 |
|
PASTEL2 |
8 |
|
SET1 |
9 |
|
SET2 |
8 |
|
SET3 |
12 |
The following SAS/IML statements create heat maps that demonstrate the color palettes. Palettes with seven colors are shown in Figure 24.270–Figure 24.272.
/* show N-color heat map for specified palette names */
start ShowSchemes(Names, N, _title);
   Name = colvec(Names);
   NumPalettes = nrow(Name);
   R = j(NumPalettes, N, "        "); /* R = ramp */
   do i = 1 to NumPalettes;
      R[i, ] = Palette(Name[i], N);
   end;

   xnames = "c1":("c"+strip(char(N)));
   x = j(nrow(R), ncol(R), .);
   idx = loc(R^=" ");
   x[idx] = 1:ncol(idx);
   colors = R[idx];
   run HeatmapDisc(x, colors) xvalues=xnames yvalues=Name
                              title=_title ShowLegend=0;
finish;

/* sequential palettes: Use for ordered value */
seq = {BLUES GREENS GREYS ORANGES PURPLES REDS /* monochrome */
       BUGN BUPU GNBU ORRD PUBU PUBUGN PURD RDPU YLGN YLGNBU YLORBR YLORRD};
ods graphics / width = 600 height=1000;
run ShowSchemes(seq, 7, "Sequential Palettes");
/* diverging palettes: Use to show high/low relative to a central value */
div = {BRBG   PIYG  PRGN   PUOR    RDBU    RDGY  RDYLBU  RDYLGN SPECTRAL};
ods graphics / width = 700 height=550;
run ShowSchemes(div, 7, "Diverging Palettes");
/* qualitative palettes: Use to show nominal value (for example, race) */
qual = {ACCENT DARK2 PAIRED PASTEL1 PASTEL2 SET1  SET2    SET3};
ods graphics / width = 600 height=480;
run ShowSchemes(qual, 7, "Qualitative Palettes");