Language Reference
CALL HISTOGRAM (x <*>SCALE="Count" | "Percent" | "Proportion" <*>DENSITY="Normal" | "Kernel" <*>REBIN={BinStart, BinWidth} <*>GRID={"X" <,"Y">} <*>LABEL={XLabel <,YLabel>} <*>XVALUES=xValues<*>YVALUES=yValues<*>PROCOPT=ProcOption<*>OTHER=Stmts );
The HISTOGRAM subroutine displays a histogram by calling the SGPLOT procedure. The argument x is a numeric vector that contains the data to plot. The HISTOGRAM subroutine is not a comprehensive interface to the SGPLOT procedure. It is intended for creating simple histogram for exploratory data analysis. The ODS statistical graphics subroutines are described in Chapter 15: Statistical Graphics.
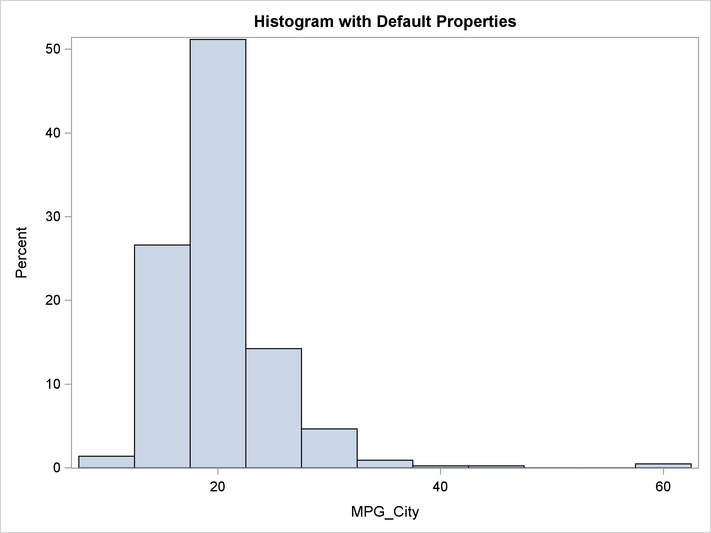
A simple example follows:
use sashelp.cars;
read all var {MPG_City};
close sashelp.cars;

title "Histogram with Default Properties";
call Histogram(MPG_City);
Specify the x vector inside parentheses and specify all options outside the parentheses. Use the global TITLE and FOOTNOTE statements to specify titles and footnotes. Each option corresponds to a statement or option in the SGPLOT procedure.
The following options correspond to options in the HISTOGRAM or DENSITY statement in the SGPLOT procedure:
- SCALE=
-
specifies the scaling to apply to the vertical axis of the histogram. Valid options are "Count" (the default), "Percent," and "Proportion."
- DENSITY=
-
specifies whether to overlay the density estimate on the histogram. The valid values are as follows:
-
DENSITY={"Normal"}overlays a normal density estimate. -
DENSITY={"Kernel"}overlays a kernel density estimate. -
DENSITY={"Normal", "Kernel"}overlays a normal and a kernel density estimate.
-
- REBIN=
-
specifies two numerical values that set the location of the first bins and the width of bins. An option of the form
REBIN={x0, h}corresponds to the BINSTART=x0 and BINWIDTH=h options in the HISTOGRAM statement in PROC SGPLOT.
The HISTOGRAM subroutine also supports the following options. The BAR subroutine documents these options and gives an example of their usage.
- GRID=
-
specifies whether to display grid lines for the X or Y axis.
- LABEL=
-
specifies axis labels for the X or Y axis.
- XVALUES=
-
specifies a vector of values for ticks for the X axis.
- YVALUES=
-
specifies a vector of values for ticks for the Y axis.
- PROCOPT=
-
specifies options in the PROC SGPLOT statement.
- OTHER=
-
specifies statements in the SGPLOT procedure.
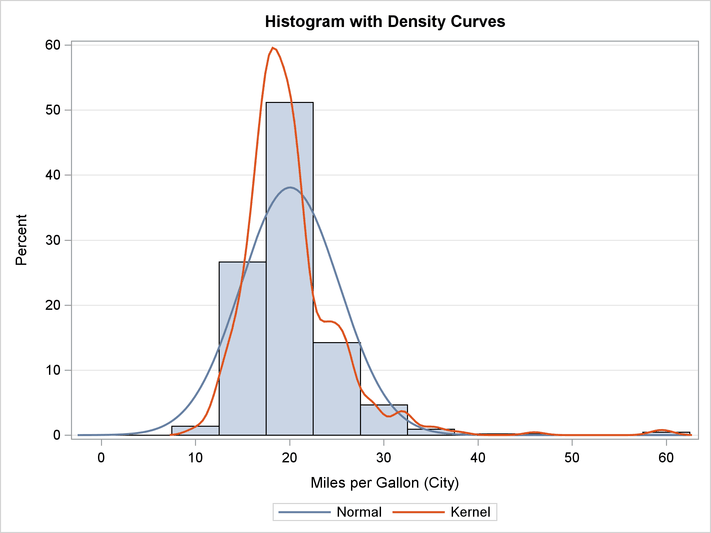
The following statements create a histogram, overlay density estimates, and specify several options:
use sashelp.cars;
read all var {MPG_City};
close sashelp.cars;

title "Histogram with Density Curves";
call Histogram(MPG_City)
          scale = "Percent"
          density={"Normal" "Kernel"}
          rebin={0 5}
          grid="y"
          label="Miles per Gallon (City)"
          xvalues = do(0, 60, 10);