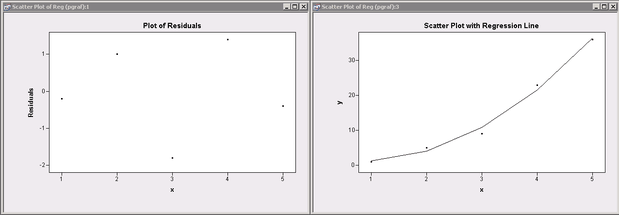
If you develop your SAS/IML programs in SAS/IML Studio, you can use high-level statistical graphics. For example, the following statements create three scatter plots that duplicate the low-resolution plots created in the previous section. Two of the plots are shown in Figure 4.10. The main steps in the program are indicated by numbered comments; these steps are explained in the list that follows the program.
x = {1 1 1, 1 2 4, 1 3 9, 1 4 16, 1 5 25};        /* 1 */
y = {1, 5, 9, 23, 36};
x1 = x[,2];                   /* data = second column of X */
x = orpol(x1,2);              /* generates orthogonal polynomials */
run Regress;                  /* runs the Regress module */

declare DataObject dobj;                          /* 2 */
dobj = DataObject.Create("Reg",                   /* 3 */
         {"x" "y" "Residuals" "Predicted"},
          x1 || y || resid || yhat);

declare ScatterPlot p1, p2, p3;
p1 = ScatterPlot.Create(dobj, "x", "Residuals");  /* 4 */
p1.SetTitleText("Plot of Residuals", true);

p2 = ScatterPlot.Create(dobj, "x", "Predicted");  /* 5 */
p2.SetTitleText("Plot of Predicted Values", true);

p3 = ScatterPlot.Create(dobj, "x", "y");          /* 6 */
p3.SetTitleText("Scatter Plot with Regression Line", true);
p3.DrawUseDataCoordinates();
p3.DrawLine(x1,yhat);                             /* 7 */
To completely understand this program, you should read SAS/IML Studio for SAS/STAT Users. The following list describes the main steps of the program:
-
Use SAS/IML to create the data and run the Regress module.
-
Specify that the
dobjvariable is an object of the DataObject class. SAS/IML Studio extends the SAS/IML language by adding object-oriented programming techniques. -
Create an object of the DataObject class from SAS/IML vectors.
-
Create a scatter plot of the residuals versus the values of the explanatory variable.
-
Create a scatter plot of the predicted values versus the values of the explanatory variable.
-
Create a scatter plot of the observed responses versus the values of the explanatory variable.
-
Overlay a line for the predicted values.