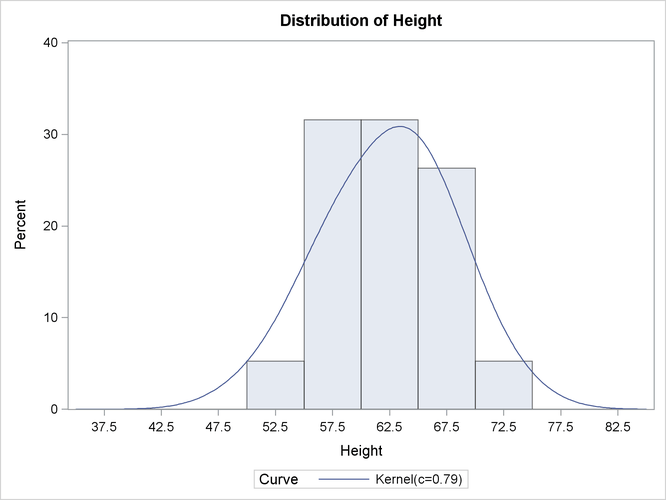
If you use the SUBMIT statement to call a SAS procedure that creates a graph, that graph is sent to the current ODS destination. The following statements call the UNIVARIATE procedure, which creates a histogram as part of the analysis:
ods graphics on;

proc iml;
msg1 = "First PRINT Statement in PROC IML";
msg2 = "Second PRINT Statement in PROC IML";
print msg1;

submit;
ods select Moments Histogram;
proc univariate data=Sashelp.Class;
   var Height;
   histogram / kernel;
run;
endsubmit;

print msg2;
ods graphics off;
When you run the program, the PROC UNIVARIATE output is interleaved with the PROC IML output. The output from the program is shown in Figure 10.6 through Figure 10.8.
Figure 10.6: Output from PROC IML and from SUBMIT Block
| msg1 |
|---|
| First PRINT Statement in PROC IML |
The UNIVARIATE Procedure
Variable: Height
| Moments | |||
|---|---|---|---|
| N | 19 | Sum Weights | 19 |
| Mean | 62.3368421 | Sum Observations | 1184.4 |
| Std Deviation | 5.12707525 | Variance | 26.2869006 |
| Skewness | -0.2596696 | Kurtosis | -0.1389692 |
| Uncorrected SS | 74304.92 | Corrected SS | 473.164211 |
| Coeff Variation | 8.22479143 | Std Error Mean | 1.17623173 |
