Each PROC IML graph is associated with two independent cartesian coordinate systems, a world coordinate system and a normalized coordinate system.
The world coordinate system is the coordinate system defined by the data. The coordinate system can be defined by the observed ranges of data values, or it could be enlarged to include the range of all reasonable values.
For example, the following data are the year-end stock prices for the fictitious ACME Corporation for the years 1971 through 1986:
|
Year |
Price |
|
|---|---|---|
|
71 |
123.75 |
|
|
72 |
128.00 |
|
|
73 |
139.75 |
|
|
74 |
155.50 |
|
|
75 |
139.75 |
|
|
76 |
151.50 |
|
|
77 |
150.375 |
|
|
78 |
149.125 |
|
|
79 |
159.50 |
|
|
80 |
152.375 |
|
|
81 |
147.00 |
|
|
82 |
134.125 |
|
|
83 |
138.75 |
|
|
84 |
123.625 |
|
|
85 |
127.125 |
|
|
86 |
125.500 |
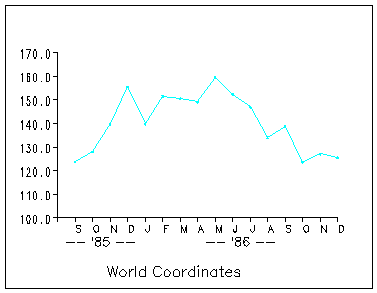
The actual range of YEAR is from 71 to 86, and the range of PRICE is from $123.625 to $159.50. These are the ranges in world coordinates for the stock data. Alternatively, you could specify that the range for PRICE is $0 to $200. Or, if you were interested only in prices during the 80’s, you could set the range for PRICE to be $123.625 to $152.375.
Figure 16.2 shows a graph of the stock data with the world coordinates defined by the actual range of the data. The corners of the rectangle correspond to the minimum and maximum values of the data.
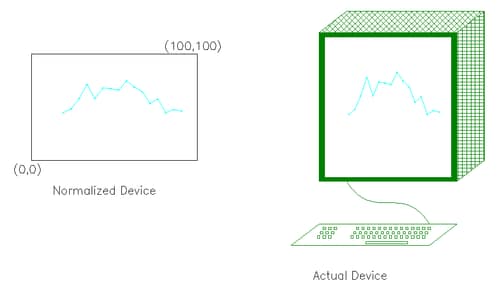
A normalized coordinate system is defined relative to your display device. It is always defined with points varying between (0,0) and (100,100), where (0,0) refers to the lower-left corner and (100,100) refers to the upper-right corner.
In summary,
-
the world coordinate system is defined relative to your data
-
the normalized coordinate system is defined relative to the display device
Figure 16.3 shows the ACME stock data in terms of normalized coordinates. There is a natural mathematical relationship between each point in world and normalized coordinates. The normalized device coordinate system is mapped to the device display area so that (0, 0), the lower-left corner, corresponds to (71, 123.625) in world coordinates, and (100, 100), the upper-right corner, corresponds to (86, 159.5) in world coordinates.