Data Smoothing: Loess
If you are trying to determine the relationship between drilling time and depth while averaging out variations in the rock strata, you might prefer the second smoother to the first. If so, you might want to remove the first smoother.
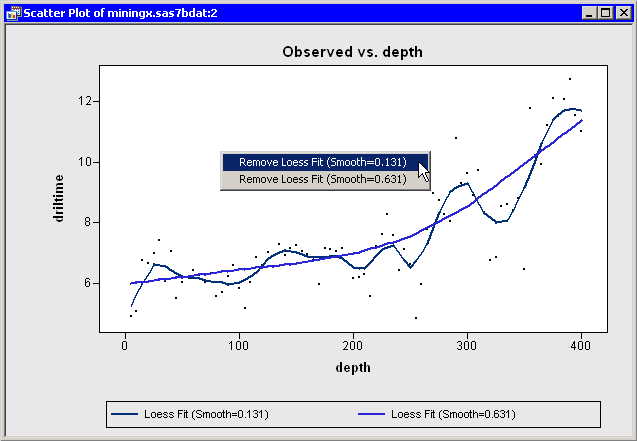
When SAS/IML Studio adds a smoother, it also adds an action menu to remove that smoother. The following steps access this menu by pressing the F11 key while the plot is active.
-
Activate the scatter plot of
driltimeversusdepthand press the F11 key.An action menu appears, as shown in Figure 18.9.
-
Select the first menu item: .
The first smoother vanishes. The plot now looks like the one in Figure 18.10.
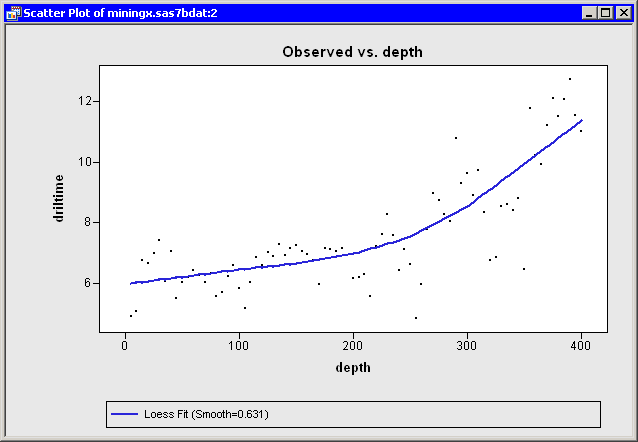
The new loess smoother indicates that the drilling time varies roughly linearly at depths between 0 and 200 feet, and linearly (with a different slope) at depths greater than 300 feet. Between 200 and 300 feet, the response varies nonlinearly. Penner and Watts (1991) suggest that air forced through the drill shaft is able to expel debris from the hole at depths less than 200 feet, but at greater depths more and more debris falls back into the hole, thus reducing the drill’s efficiency.
You can use the techniques presented in this example to compare the loess model to other smoothers. For example, you might decide to compare the loess curve to a quadratic polynomial. If the predictions are nearly the same, you might favor the simpler model.