Interacting with Plots
The following steps insert text that displays certain statistics that are related to a scatter plot of two variables:
-
Open the
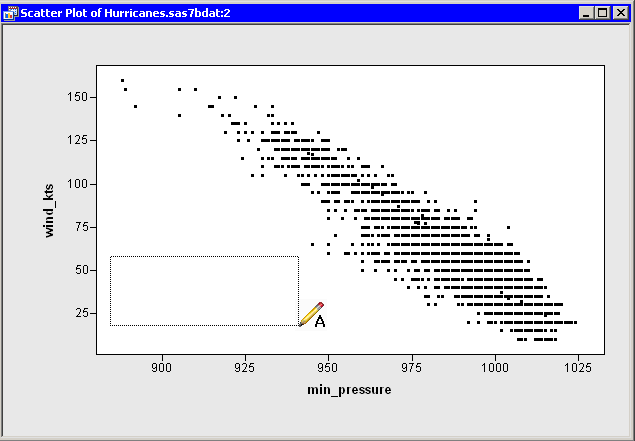
Hurricanesdata set, and create a scatter plot ofwind_ktsversusmin_pressure.The scatter plot shows a strong negative correlation between wind speed and pressure. (See Figure 8.4.) A correlation analysis reveals the following:
-
There are 6,185 observations for which both variables are nonmissing.
-
The correlation between these two variables is approximately –0.93.
You can display these statistics on the plot.
-
-
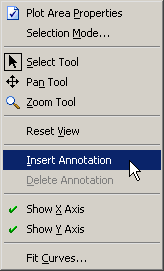
Right-click in the plot, and select from the pop-up menu.
The mouse pointer changes its shape. It looks like a pencil with the letter "A" next to it.
-
Draw a rectangle with the mouse pointer, as shown in Figure 8.4.
-
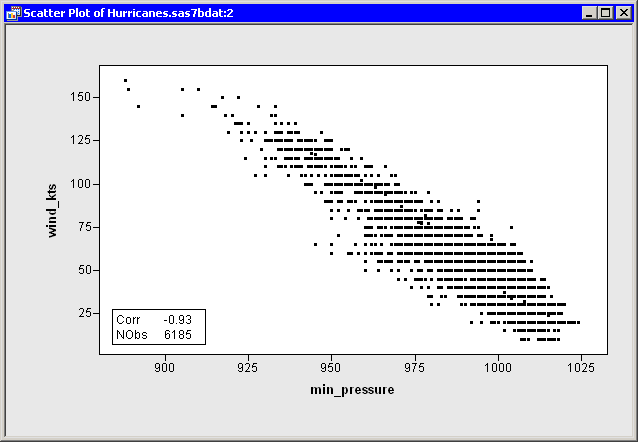
Type text into the text box, as shown in Figure 8.5. When you are finished editing the text, click outside the text box.
You can resize or move the text rectangle after it is created, if necessary. You can also right-click the text box to change properties of the text or the text box. For example, in Figure 8.5 the text box is displayed with a border around it. The annotation properties are discussed in the section Annotation Properties.
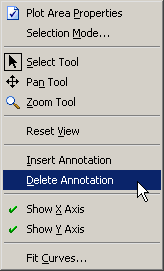
If you decide to delete the annotation, click the text box to select it. Then right-click outside the text box, and select from the pop-up menu, as shown in Figure 8.6.
Note: If you right-click inside the text box, you get a different menu, as discussed in the following section.